

Power Automate
Automate and optimize business processes
- Optimize processes and uncover business automation opportunities with task and process mining.Automate across nearly unlimited systems, desktop apps, and websites with AI and digital and robotic process automation.Confidently scale automation across your organization with built-in security, governance, and 360-degree monitoring.Accelerate digital transformation with automation-infused apps, websites, chatbots, and more in Microsoft Power Platform.
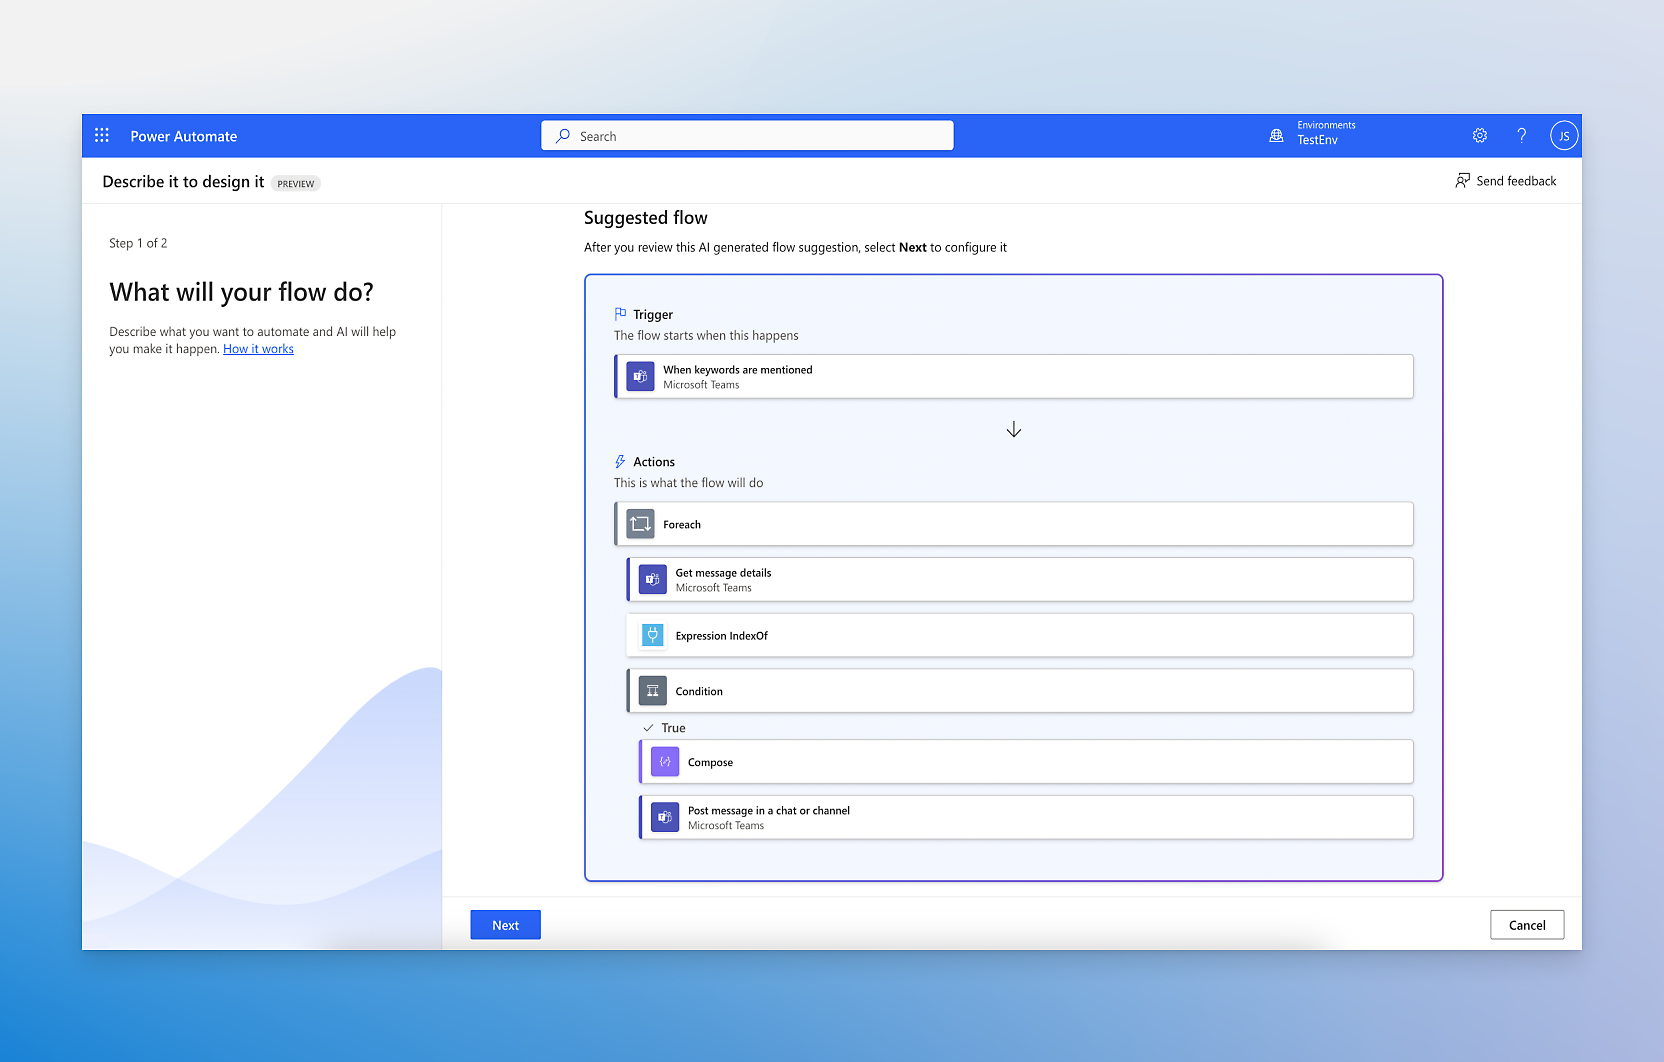

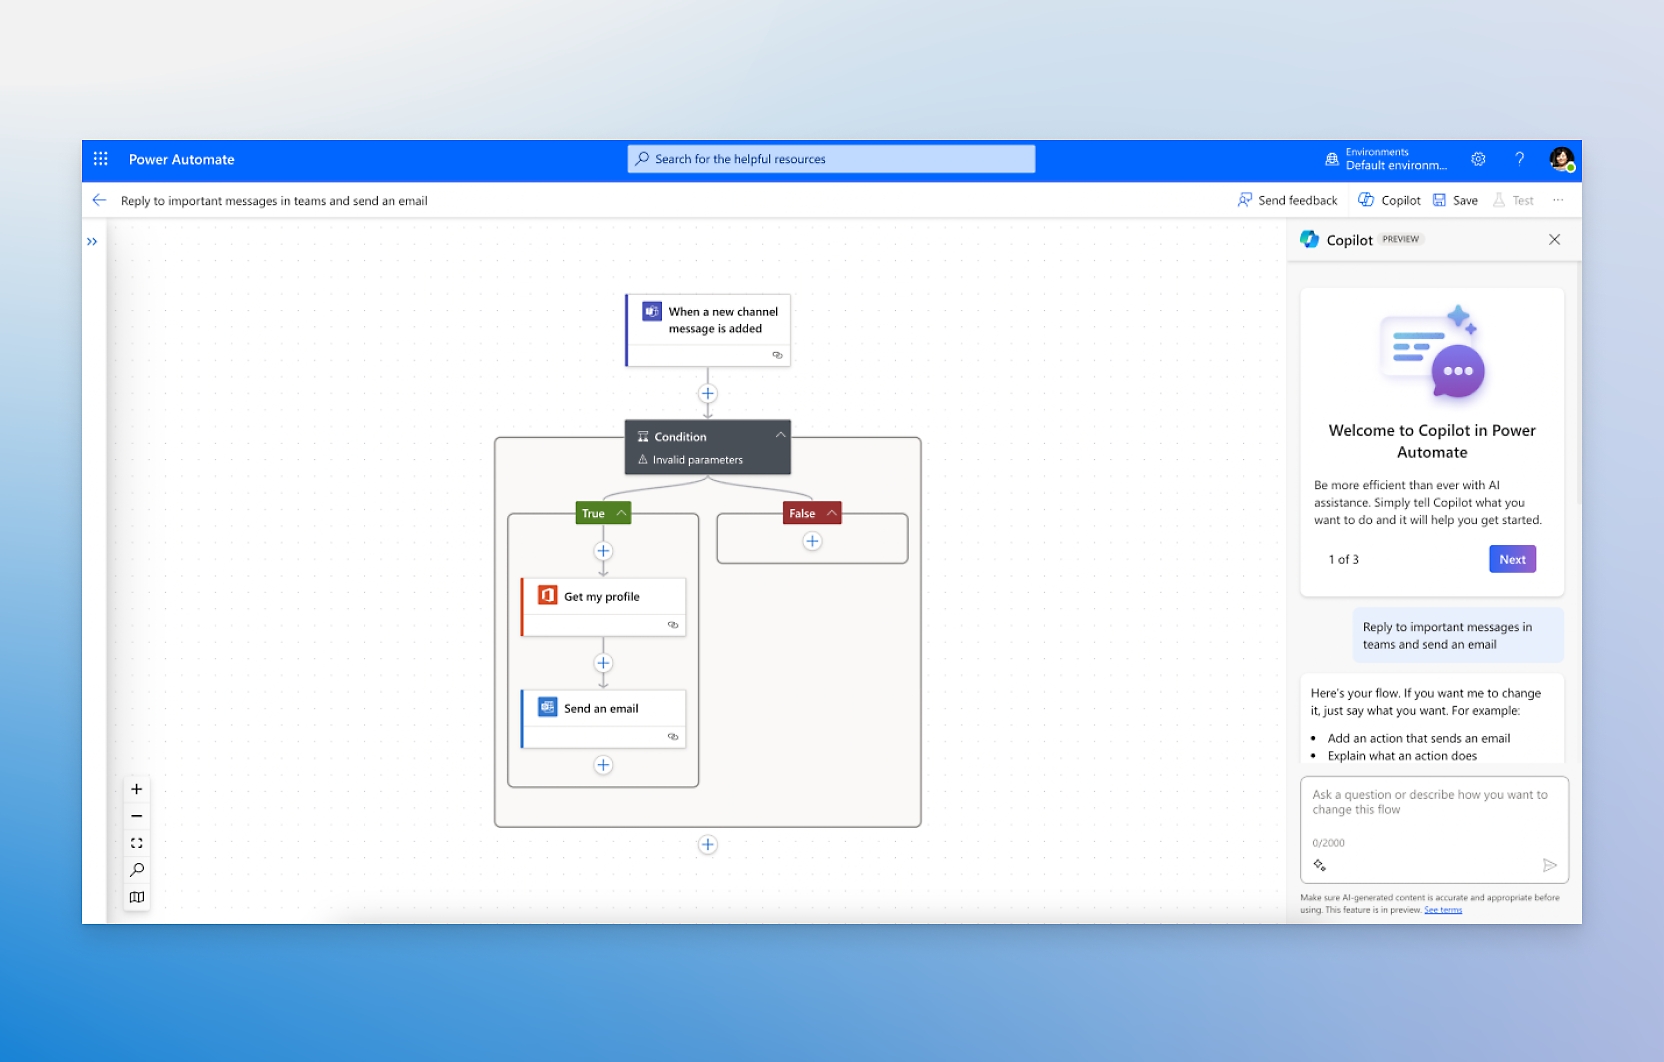
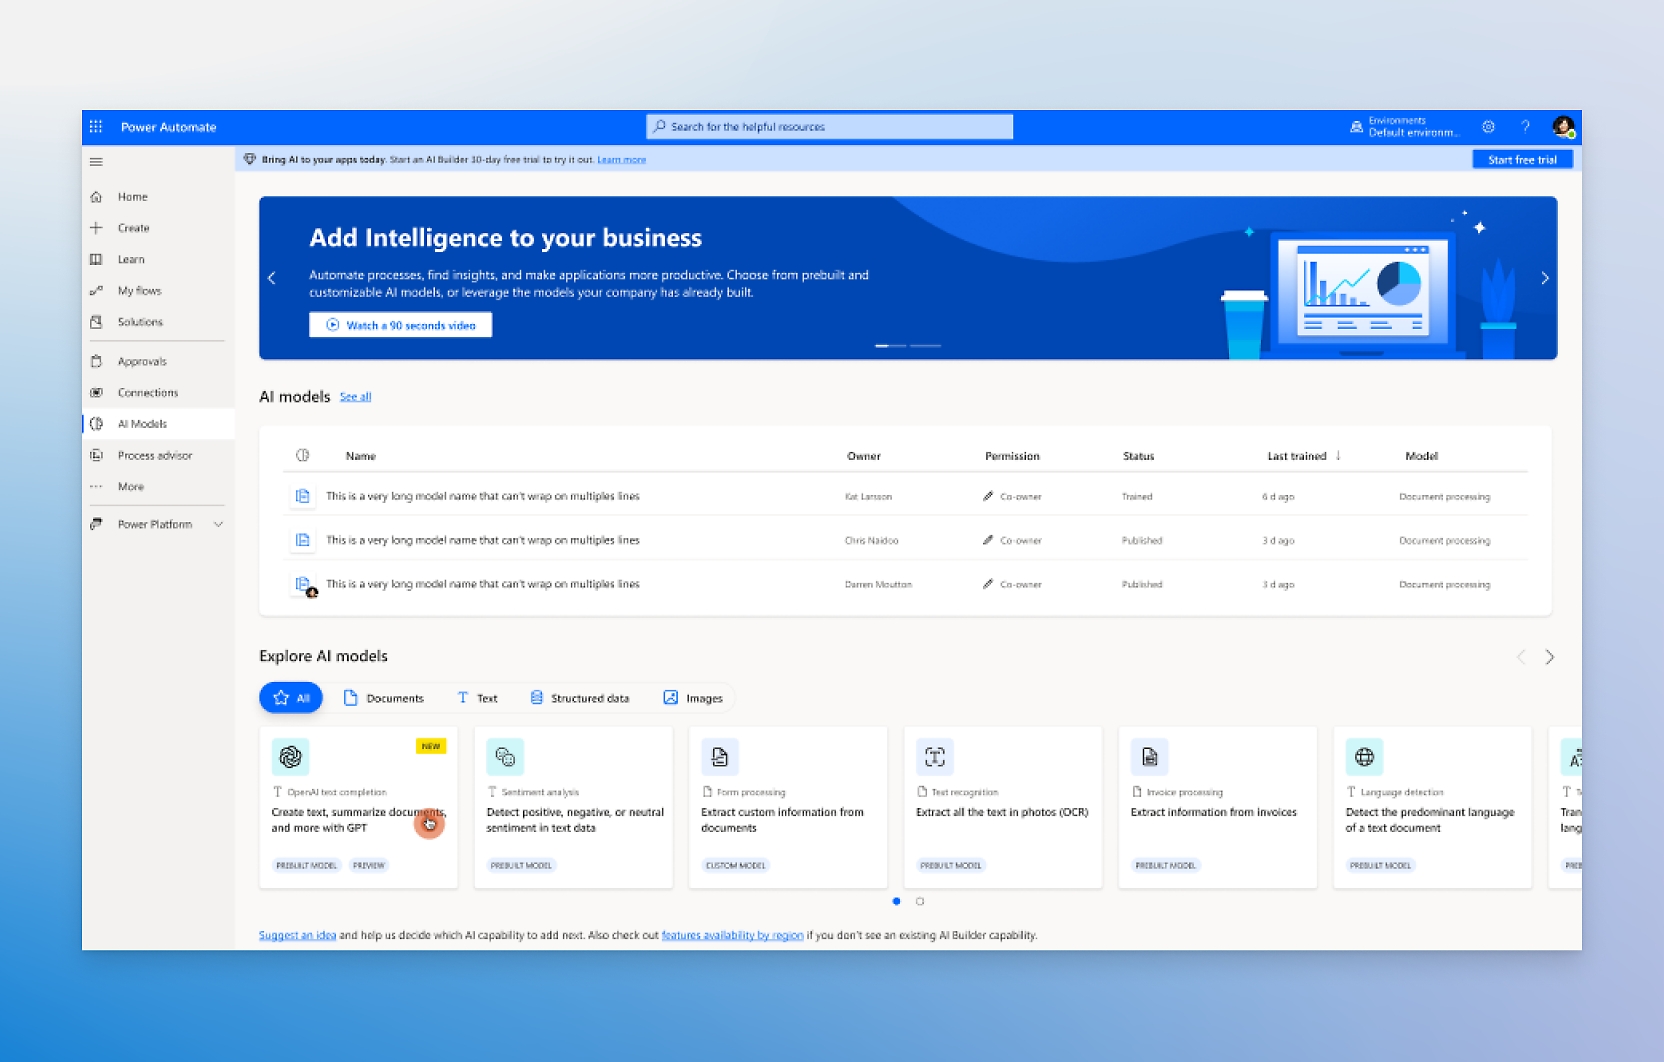
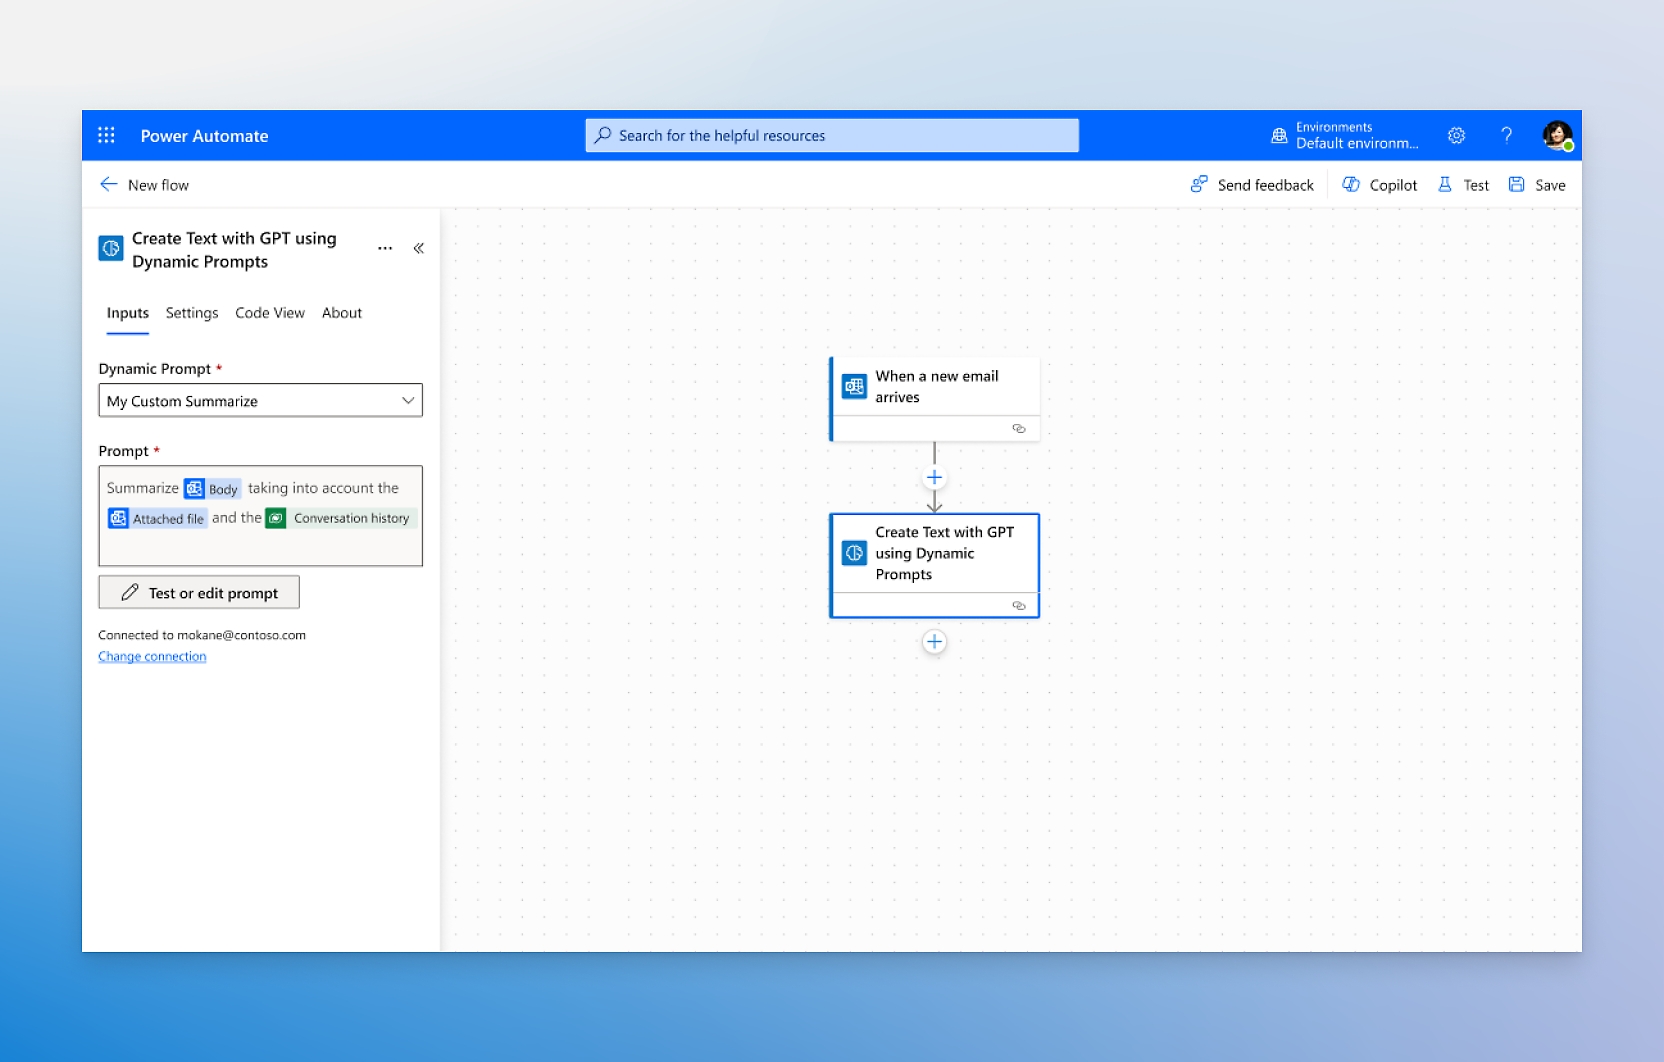
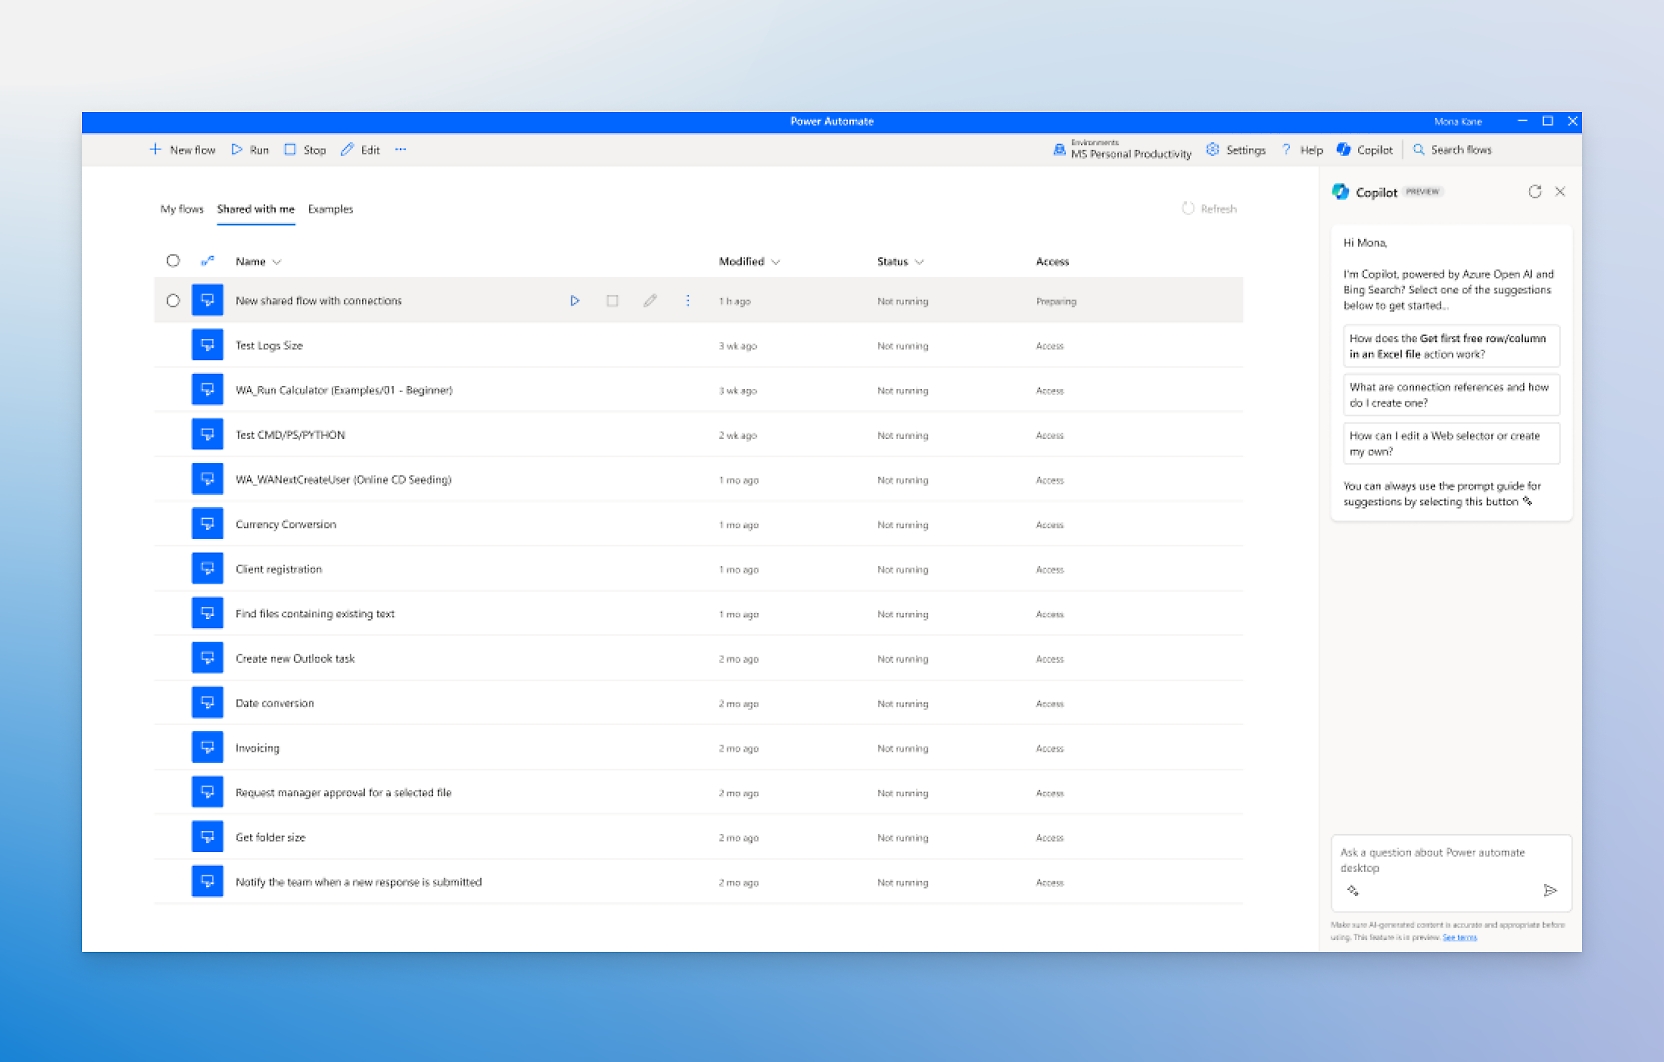
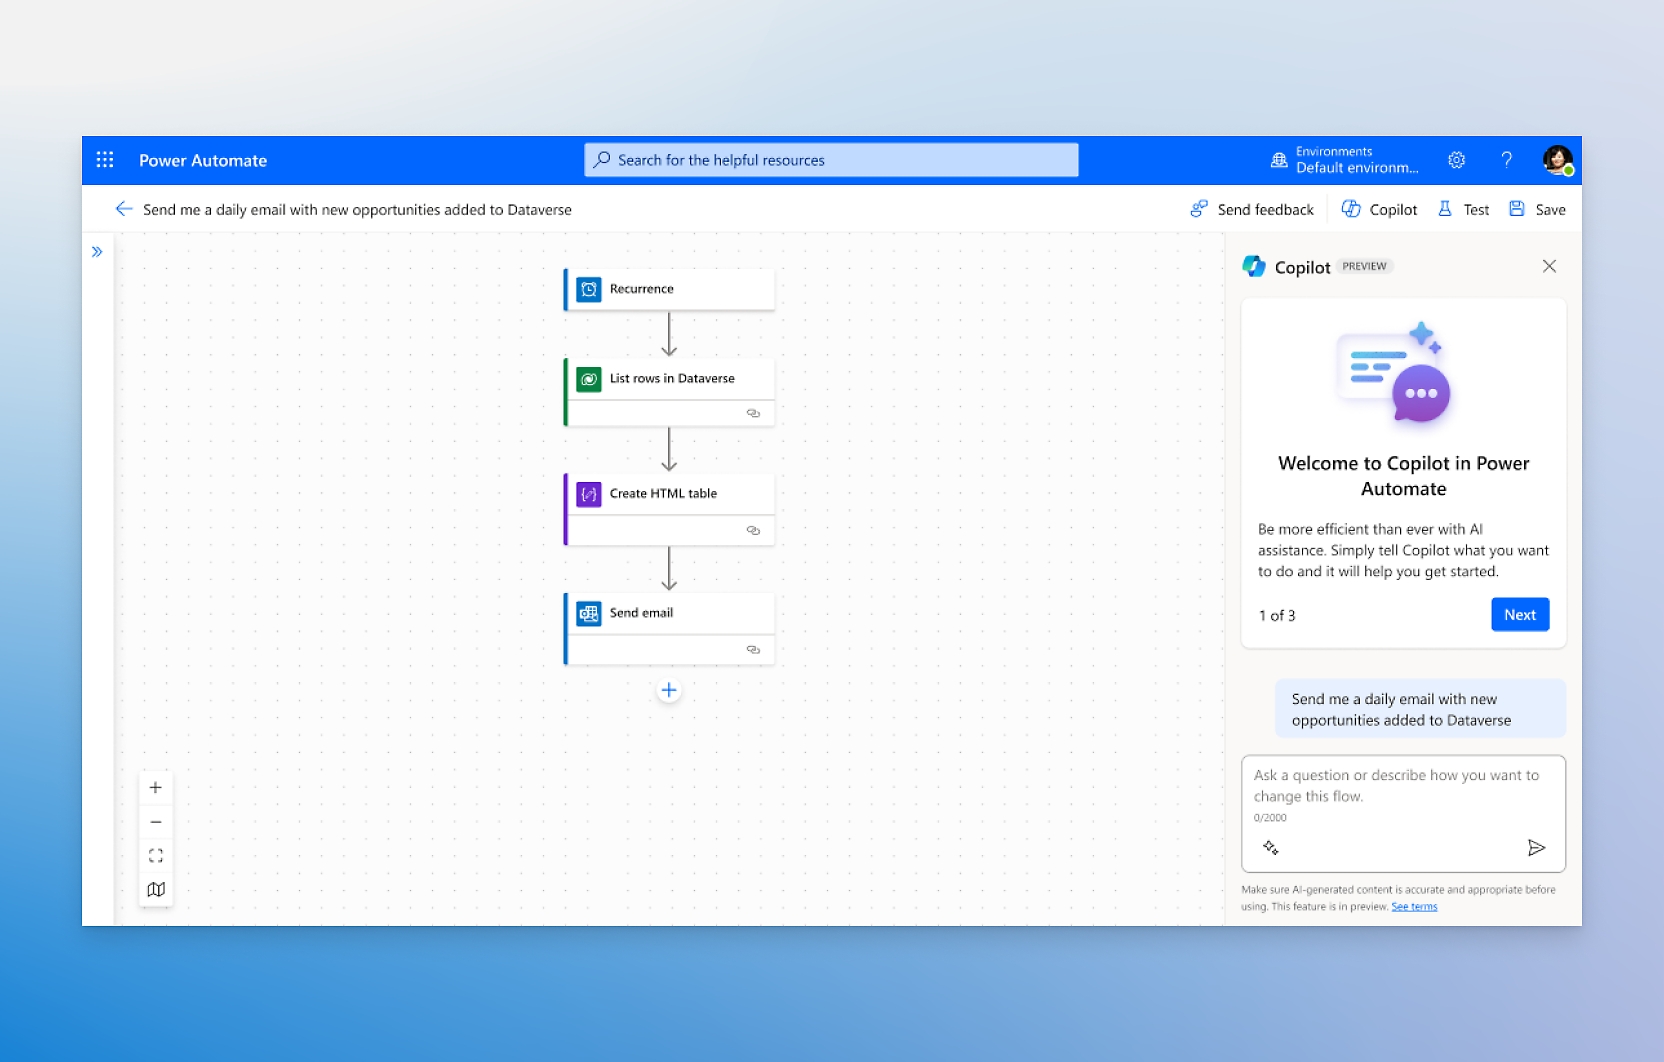
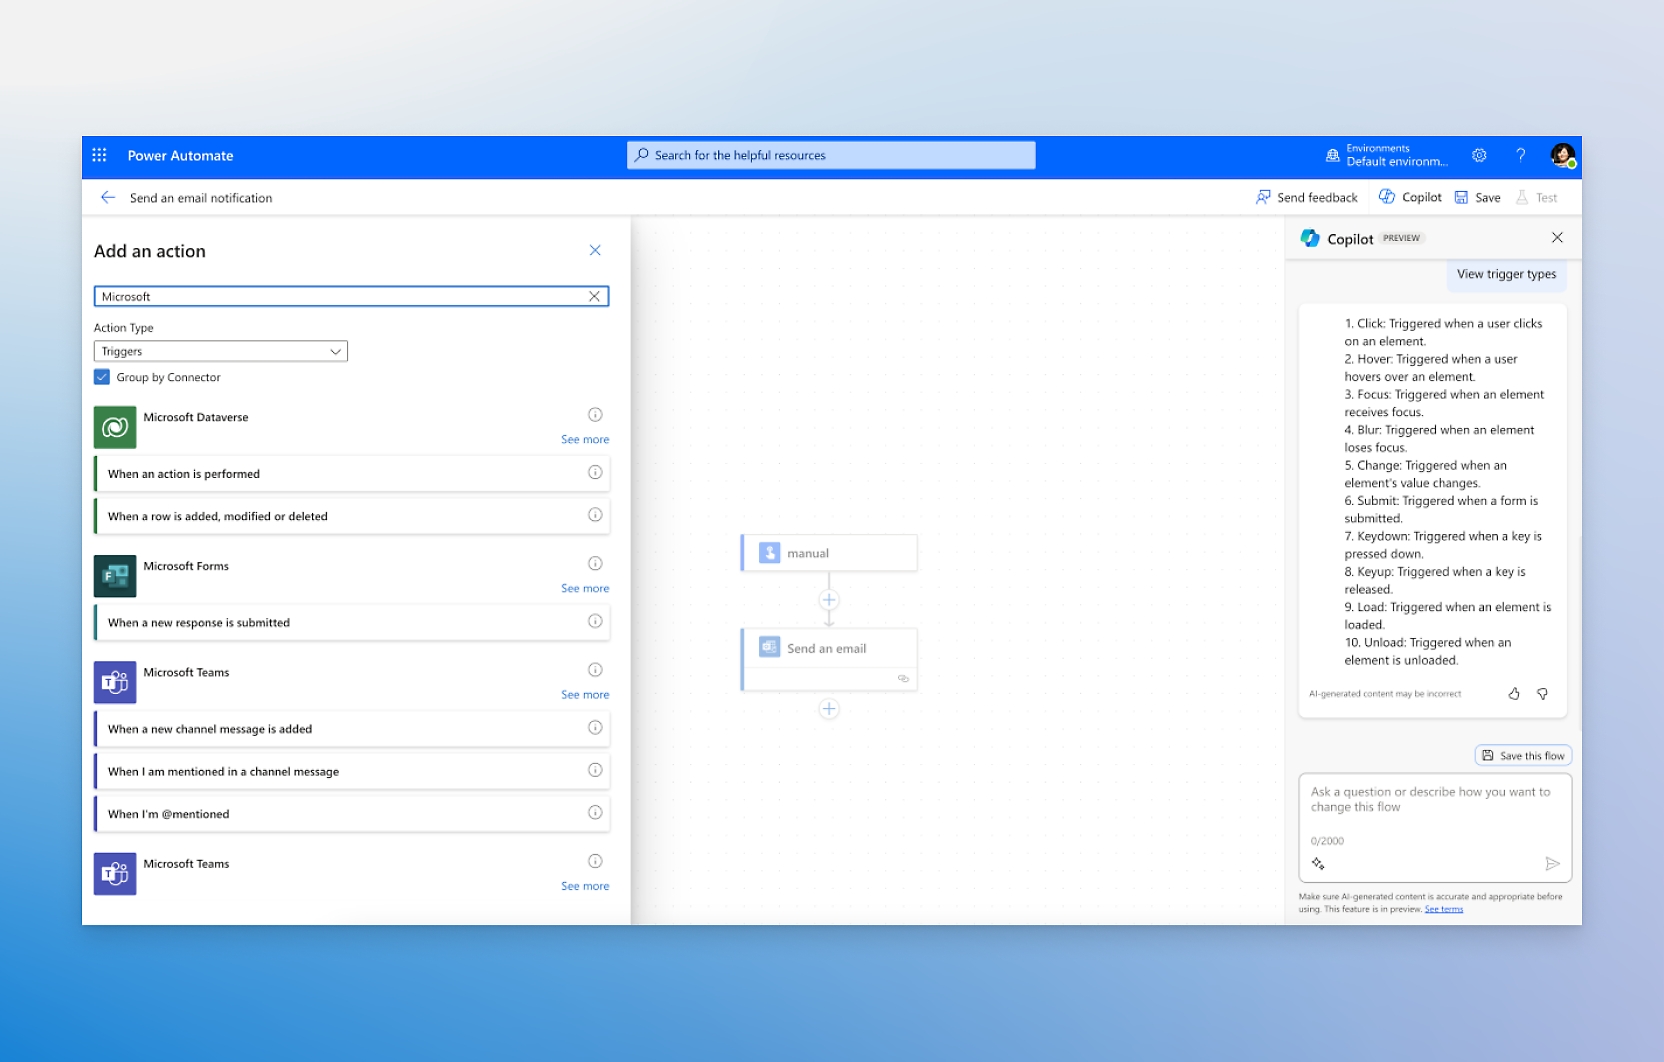
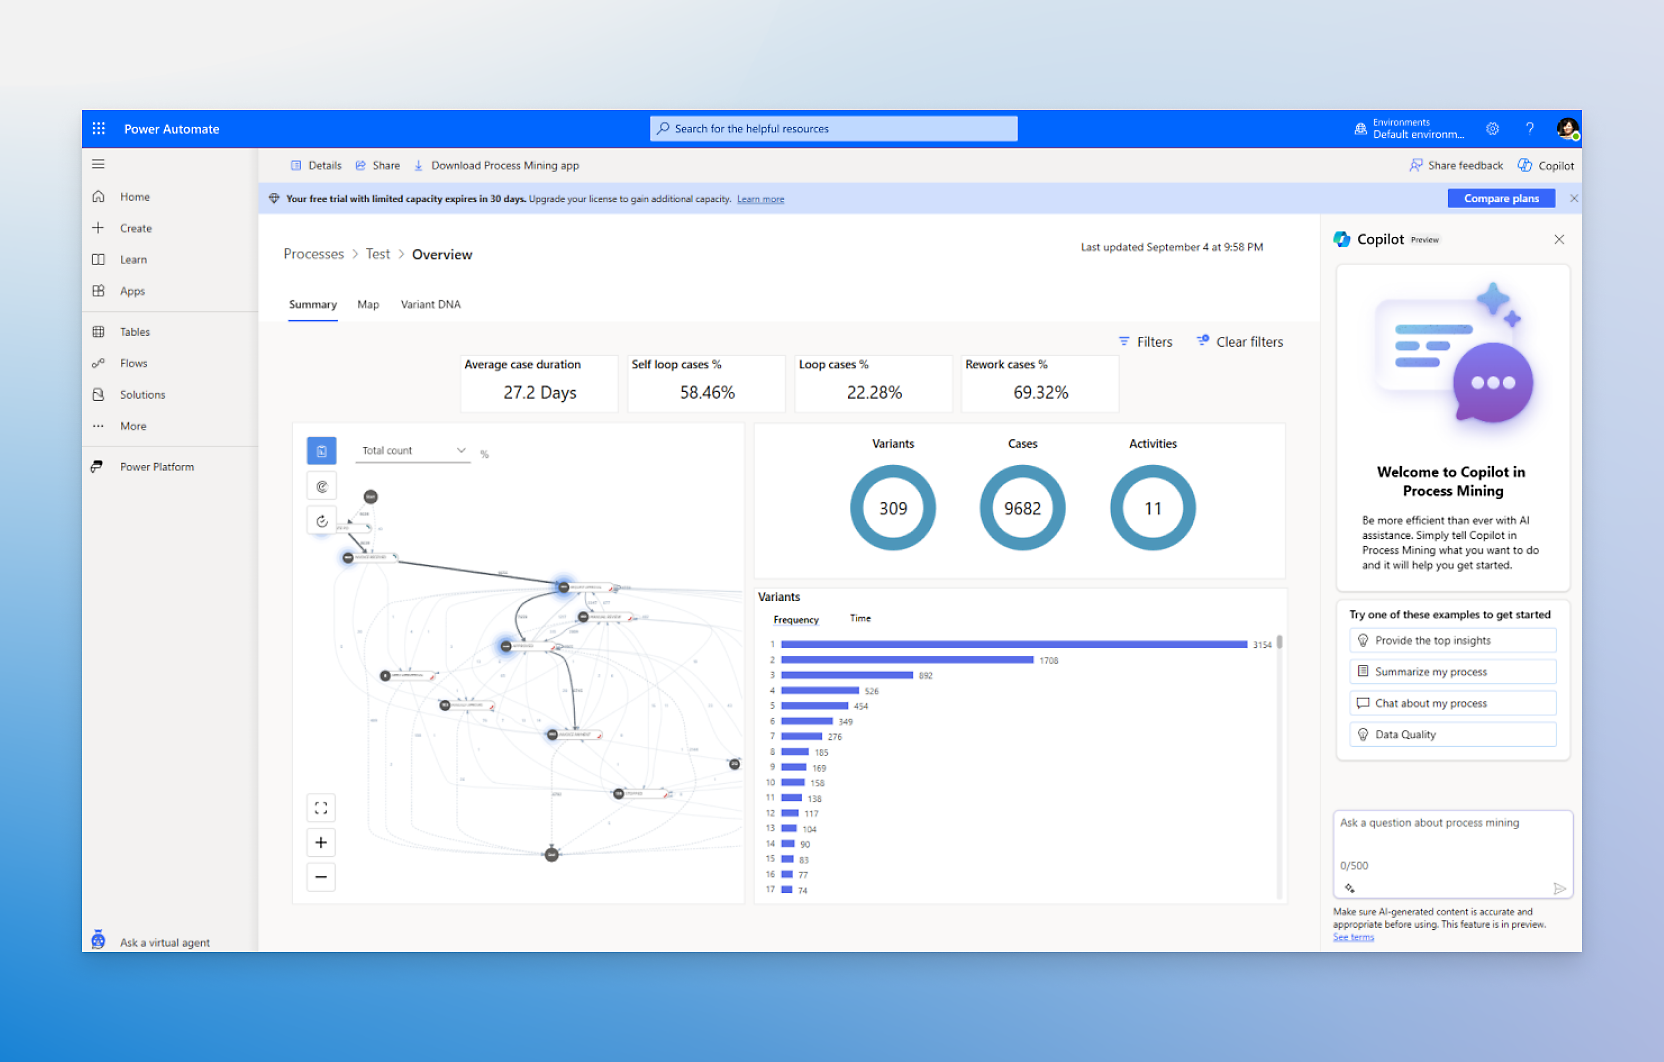
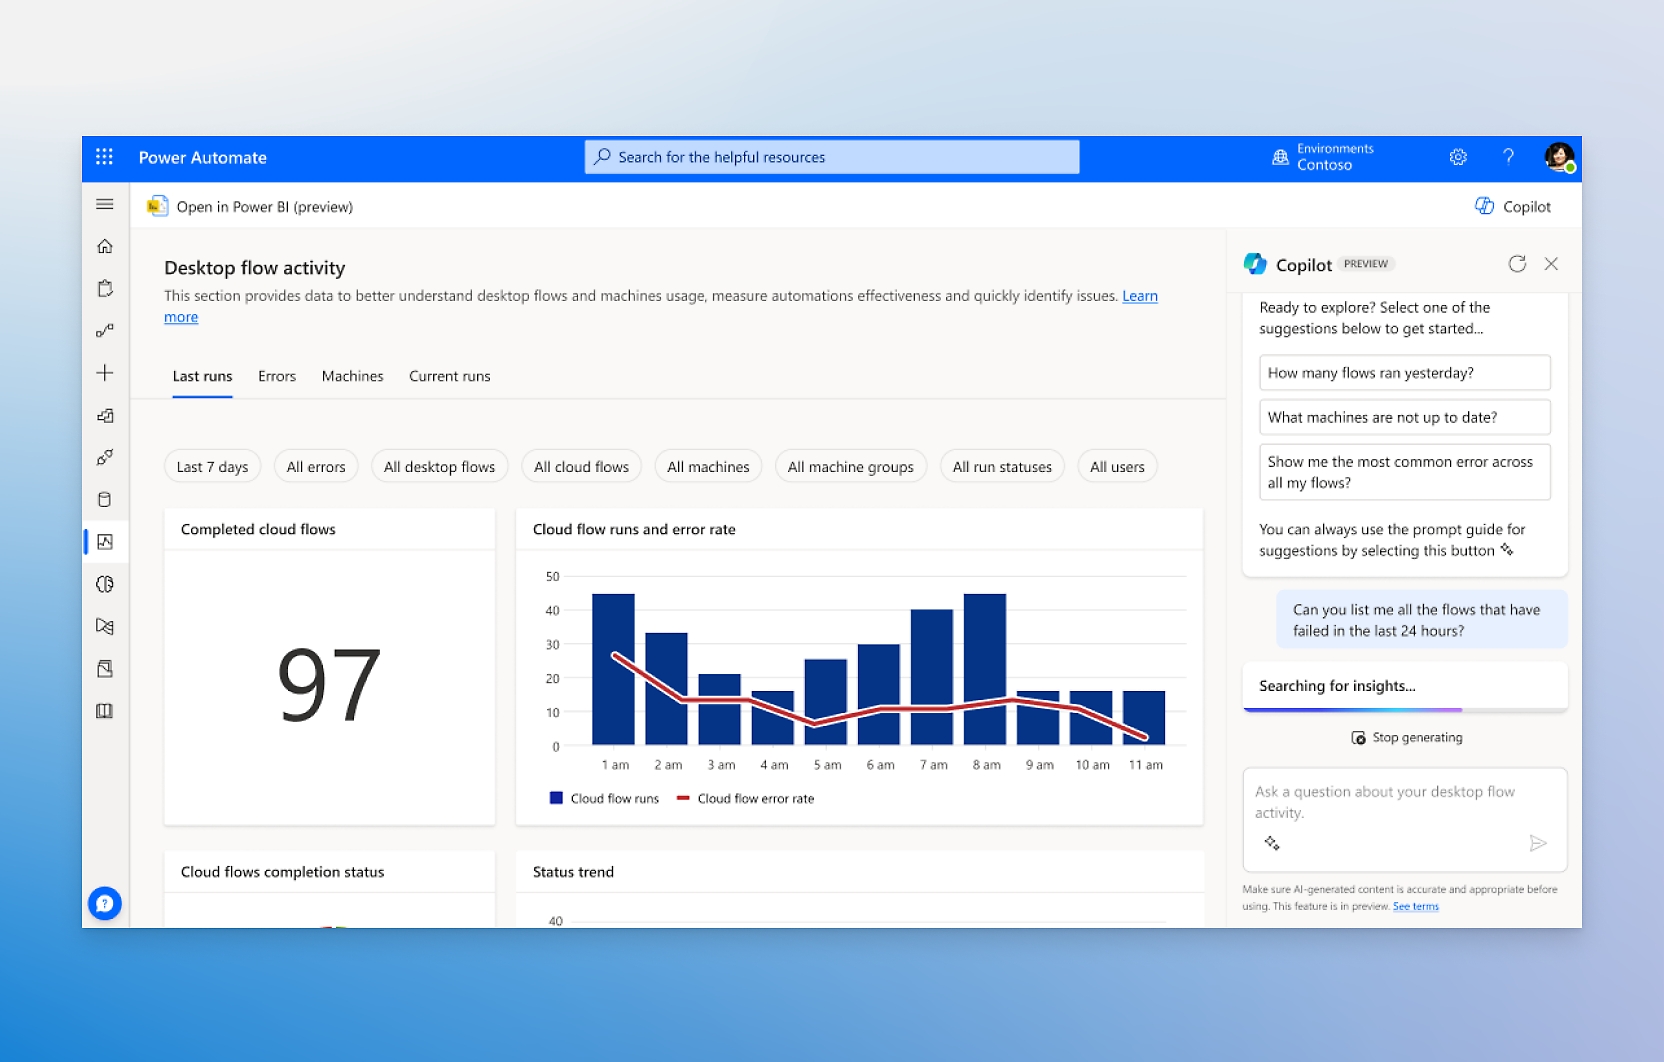
- Create, edit, and extend process automation faster using natural language with Copilot in Power Automate.Uncover optimization and automation opportunities faster with AI recommendations.Apply leading built-in AI models to intelligently automate repetitive work on documents and more.Turn your raw data into engaging content responsibly with built-in GPT support.
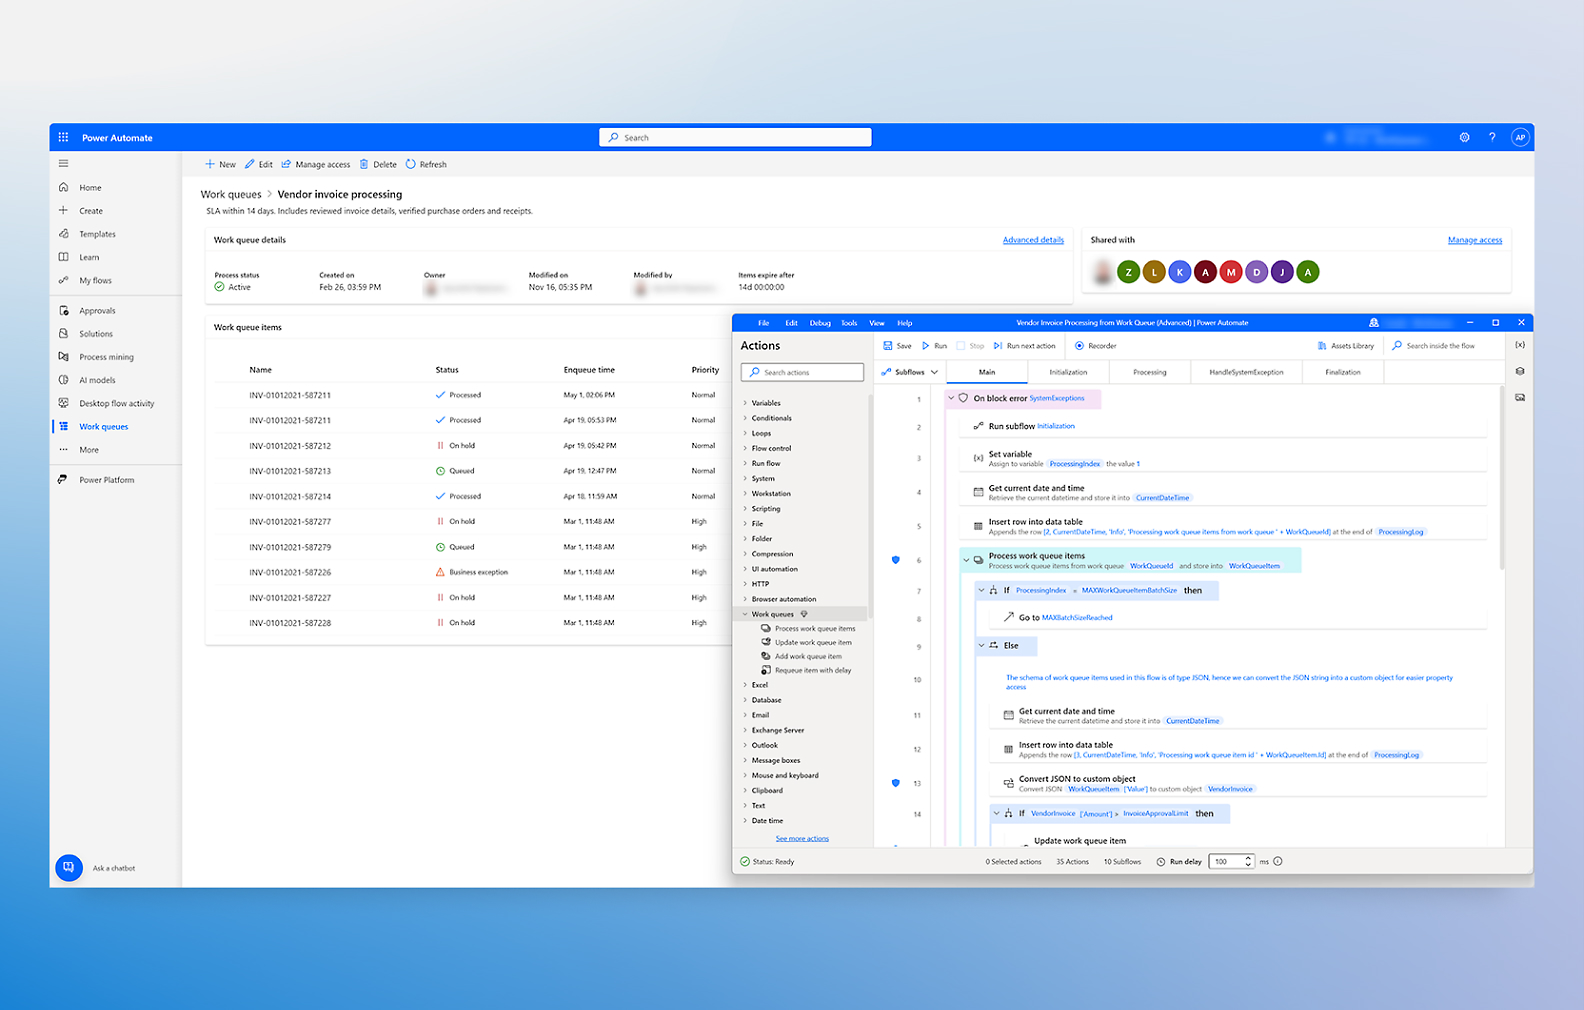
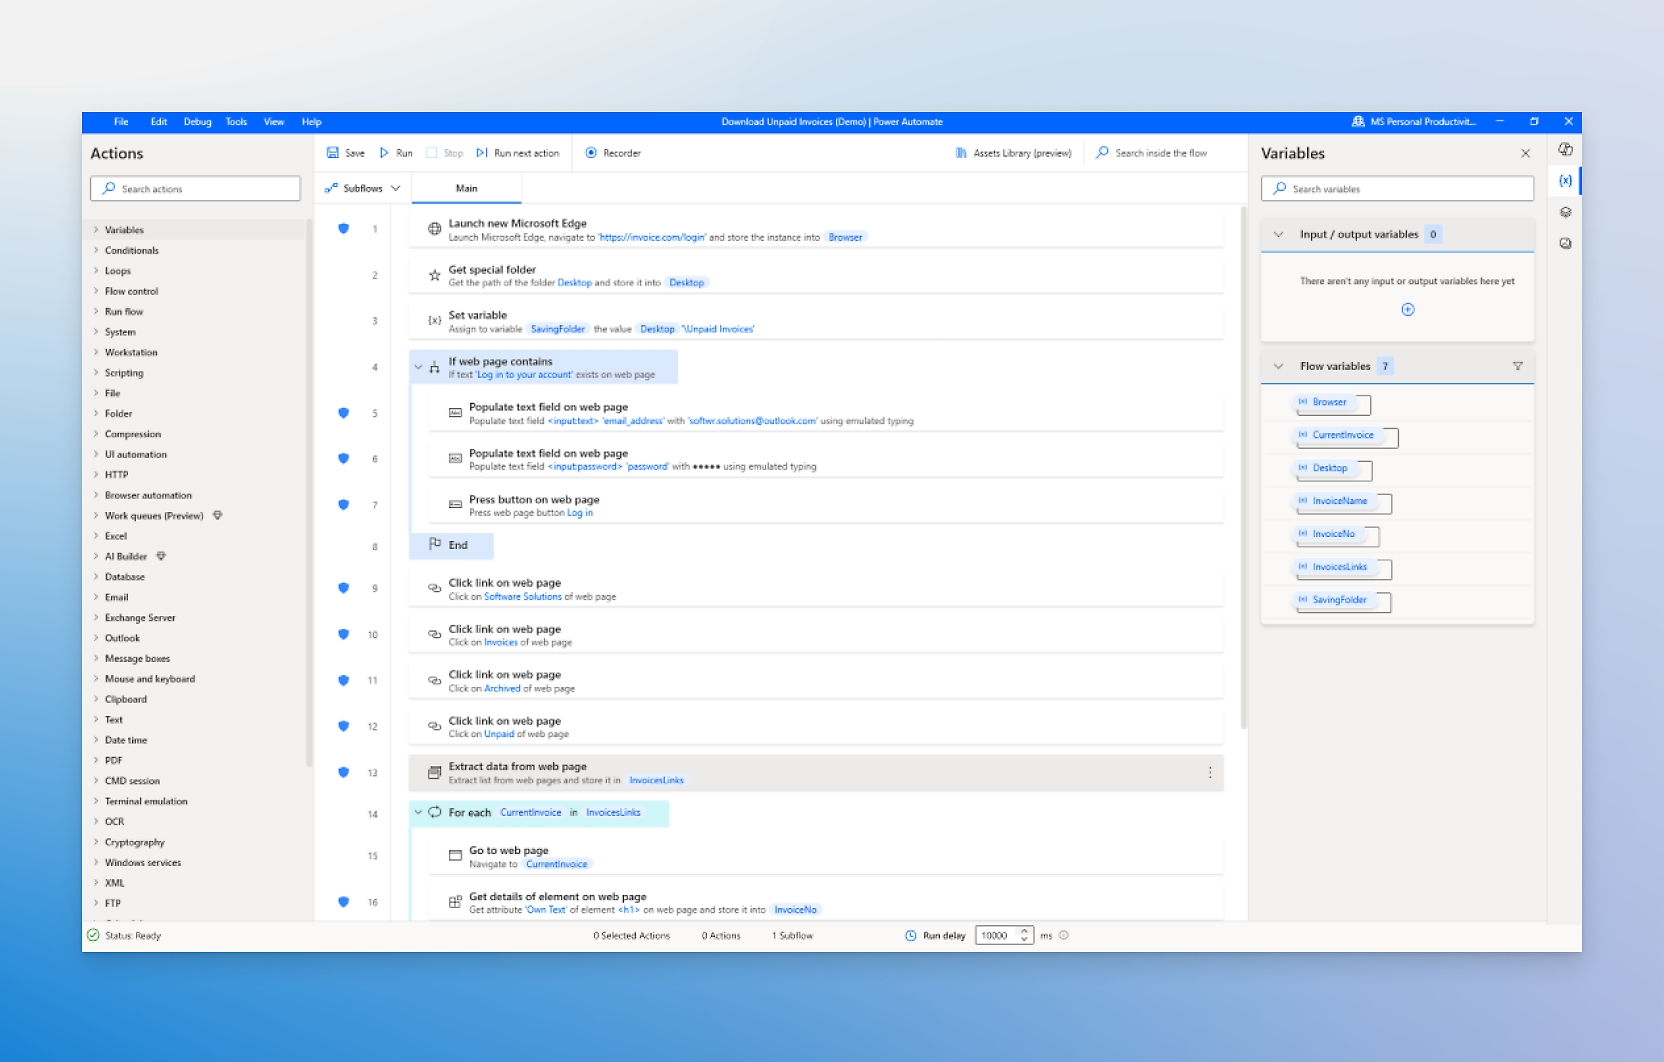
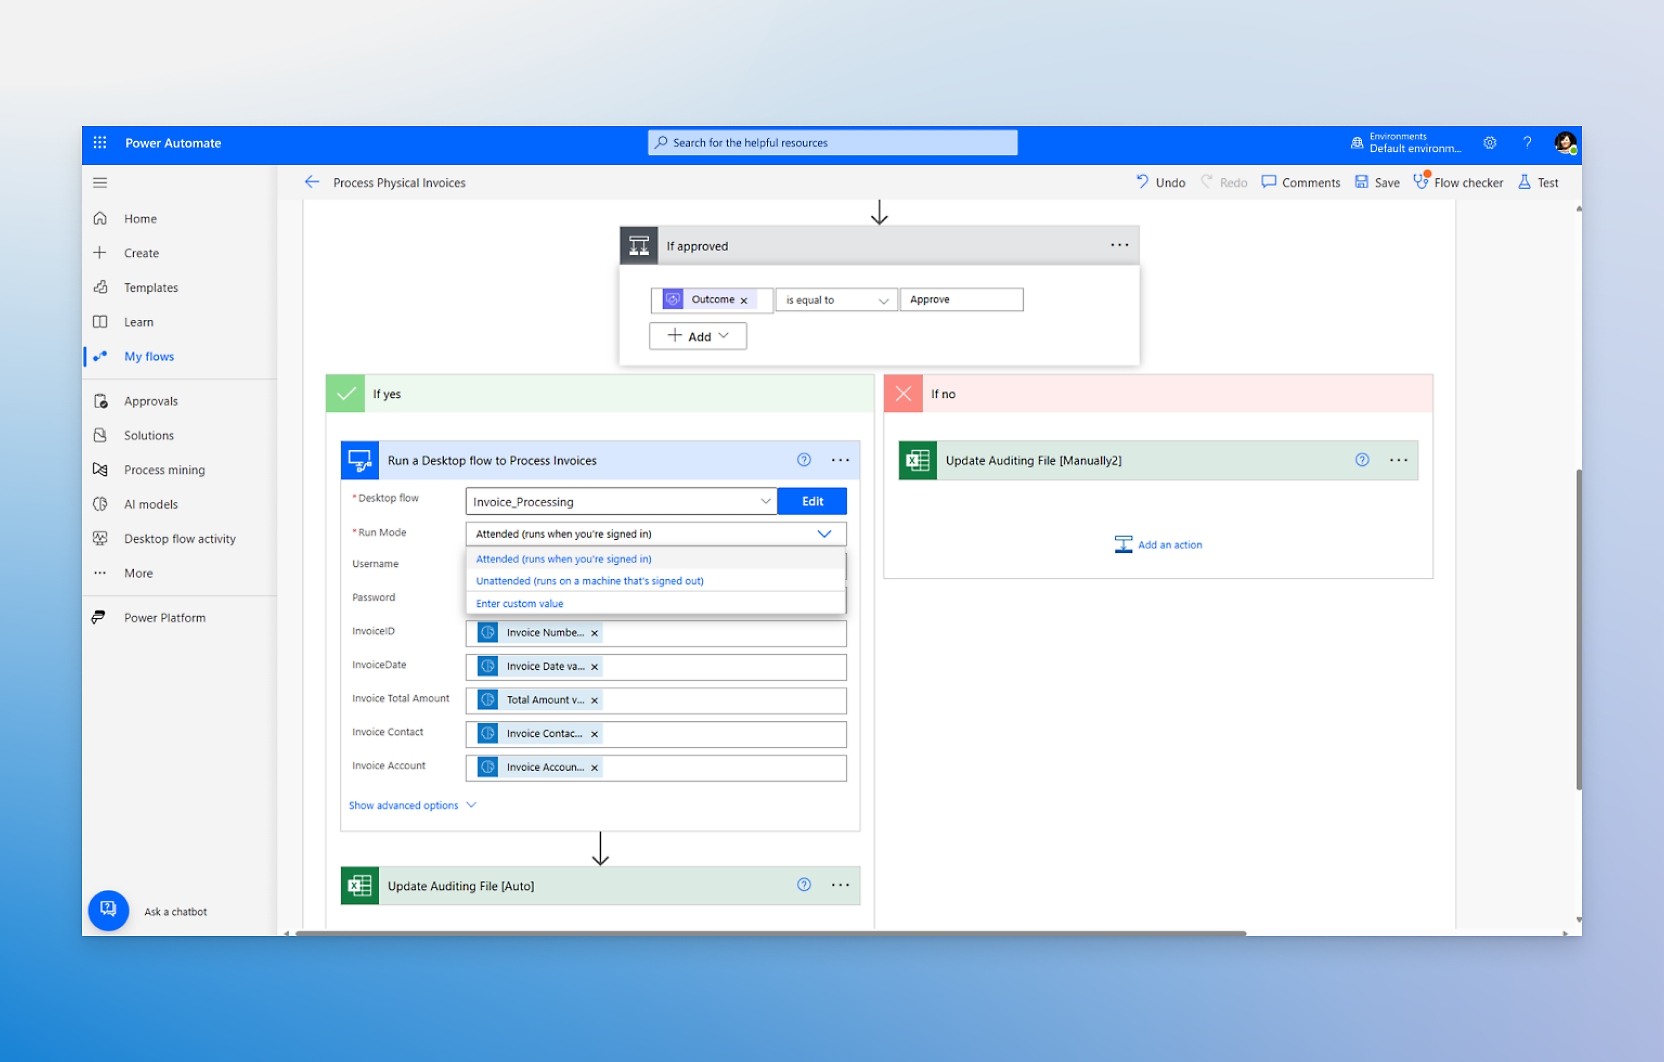
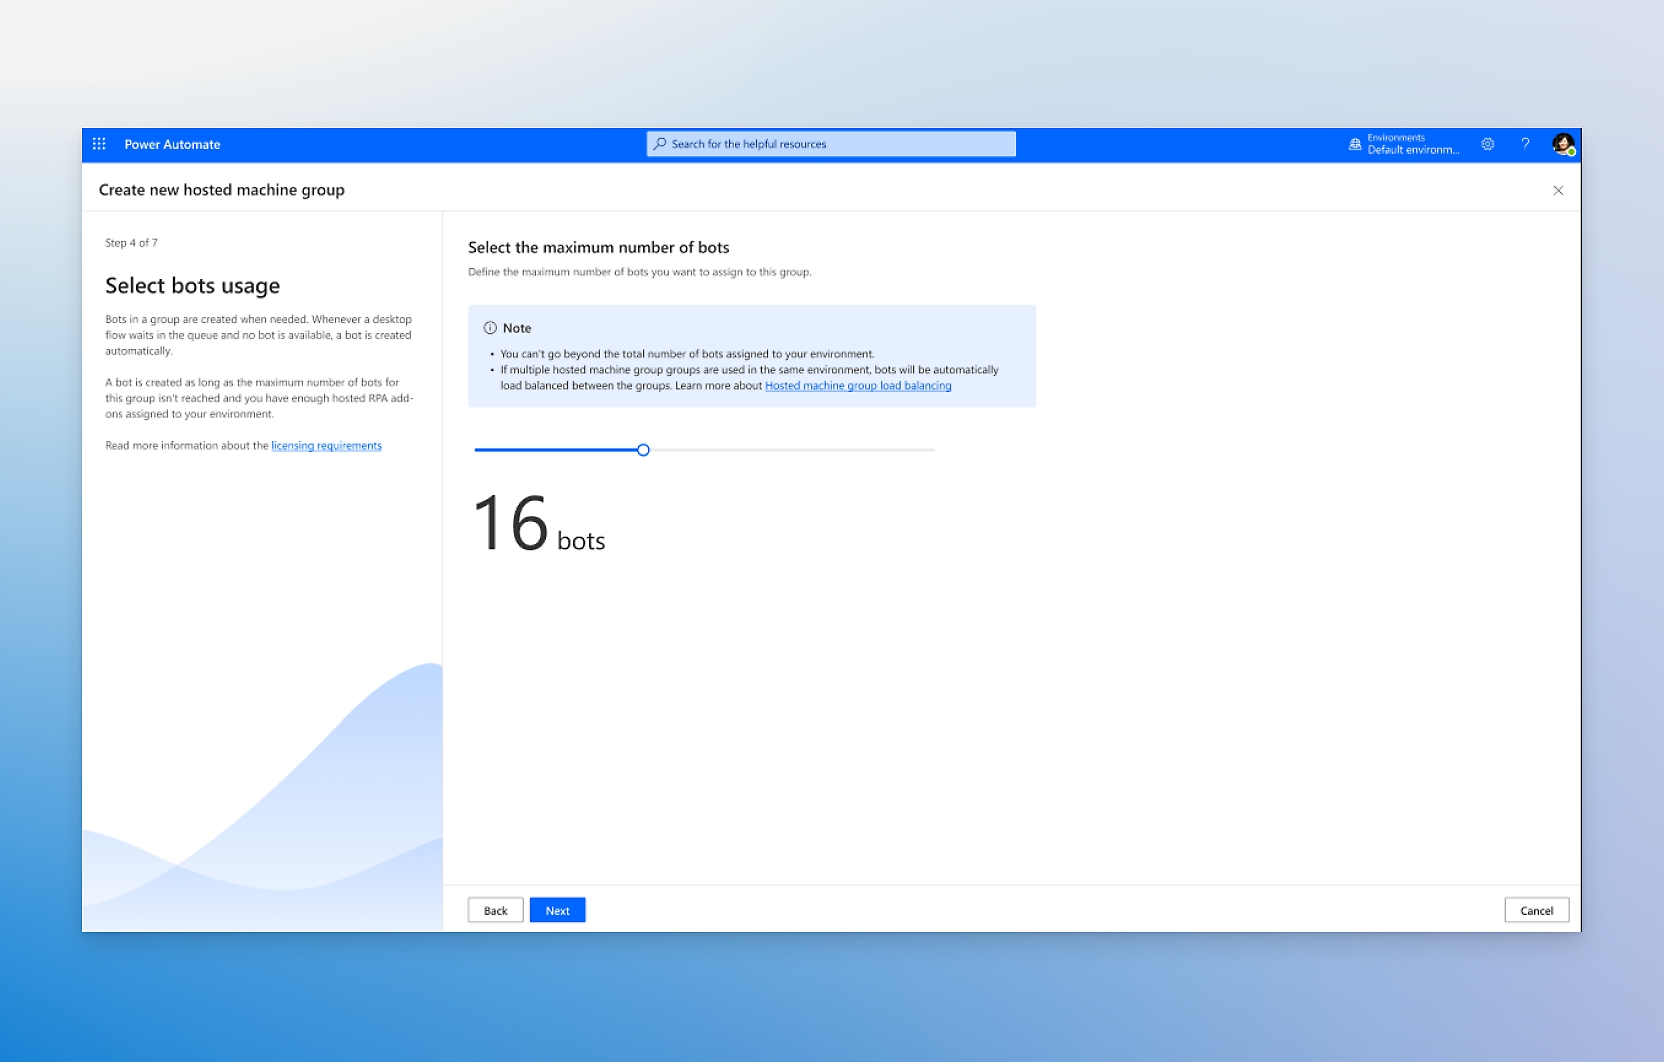
- Use robotic process automation (RPA) to automate legacy systems with prebuilt or custom user-interface actions.Use the copilot experience in Power Automate for desktop to accelerate development.Run automation with human interaction or autonomously in the background.Manage peaks and optimize resources with hosted infrastructure that automatically scales and dynamically balances loads.
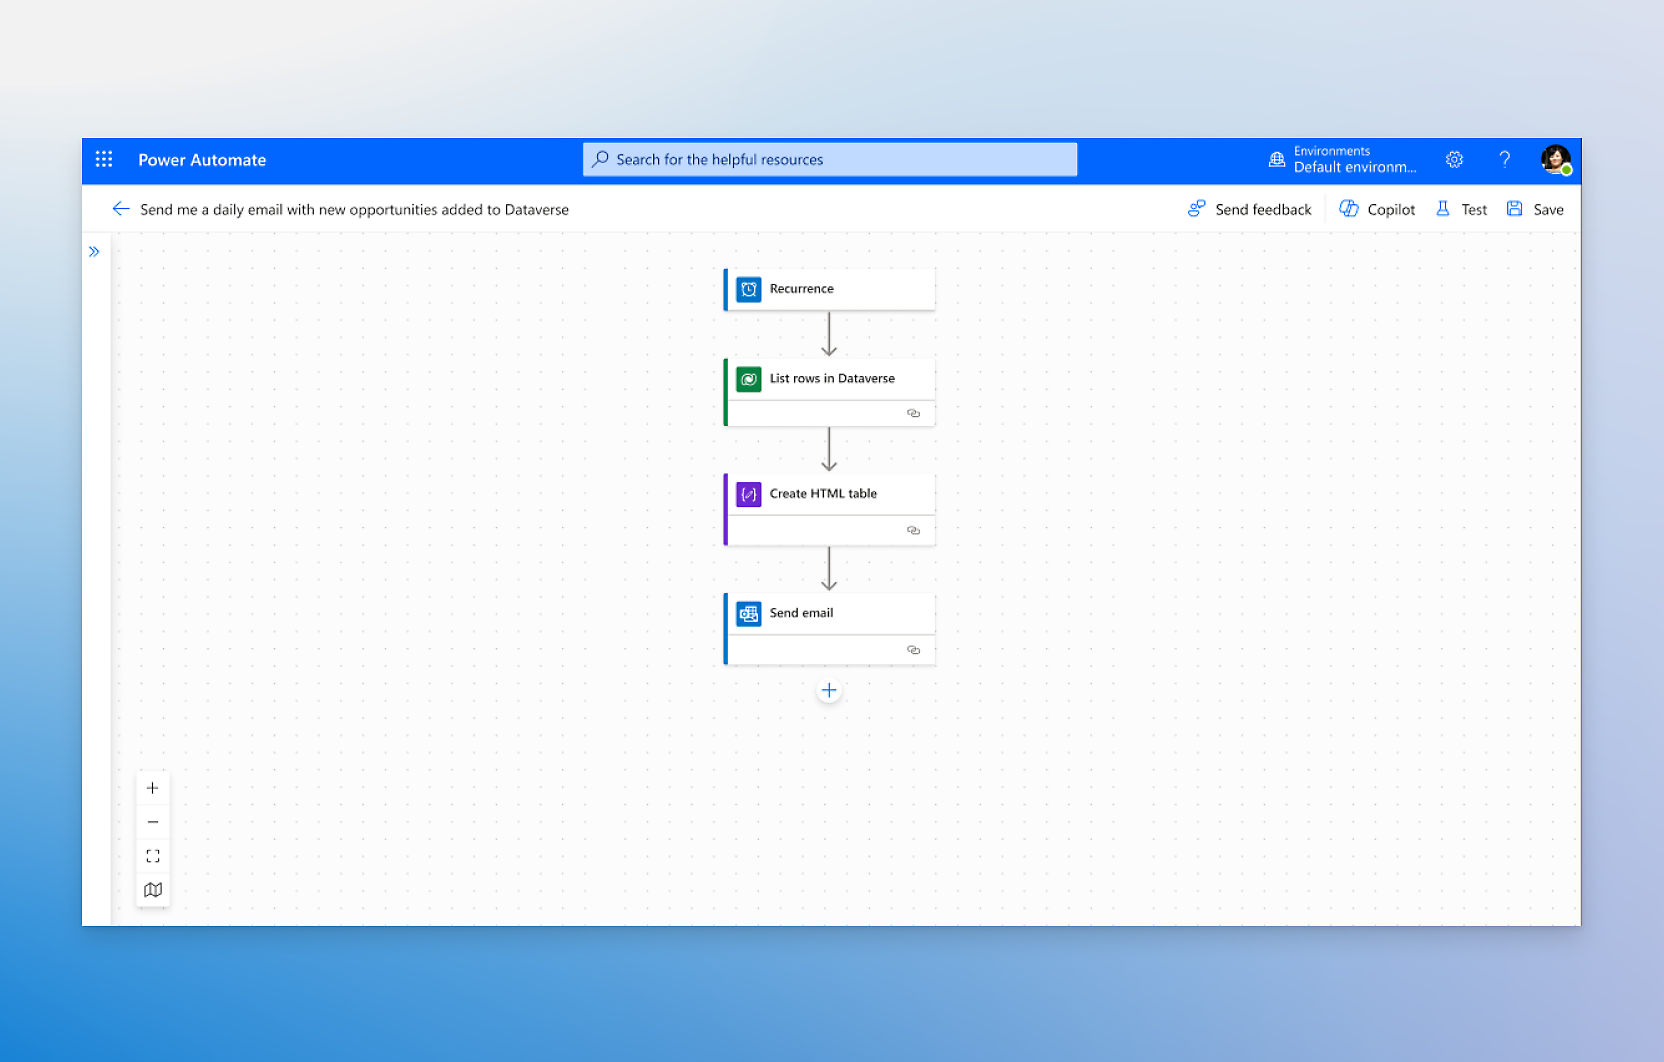
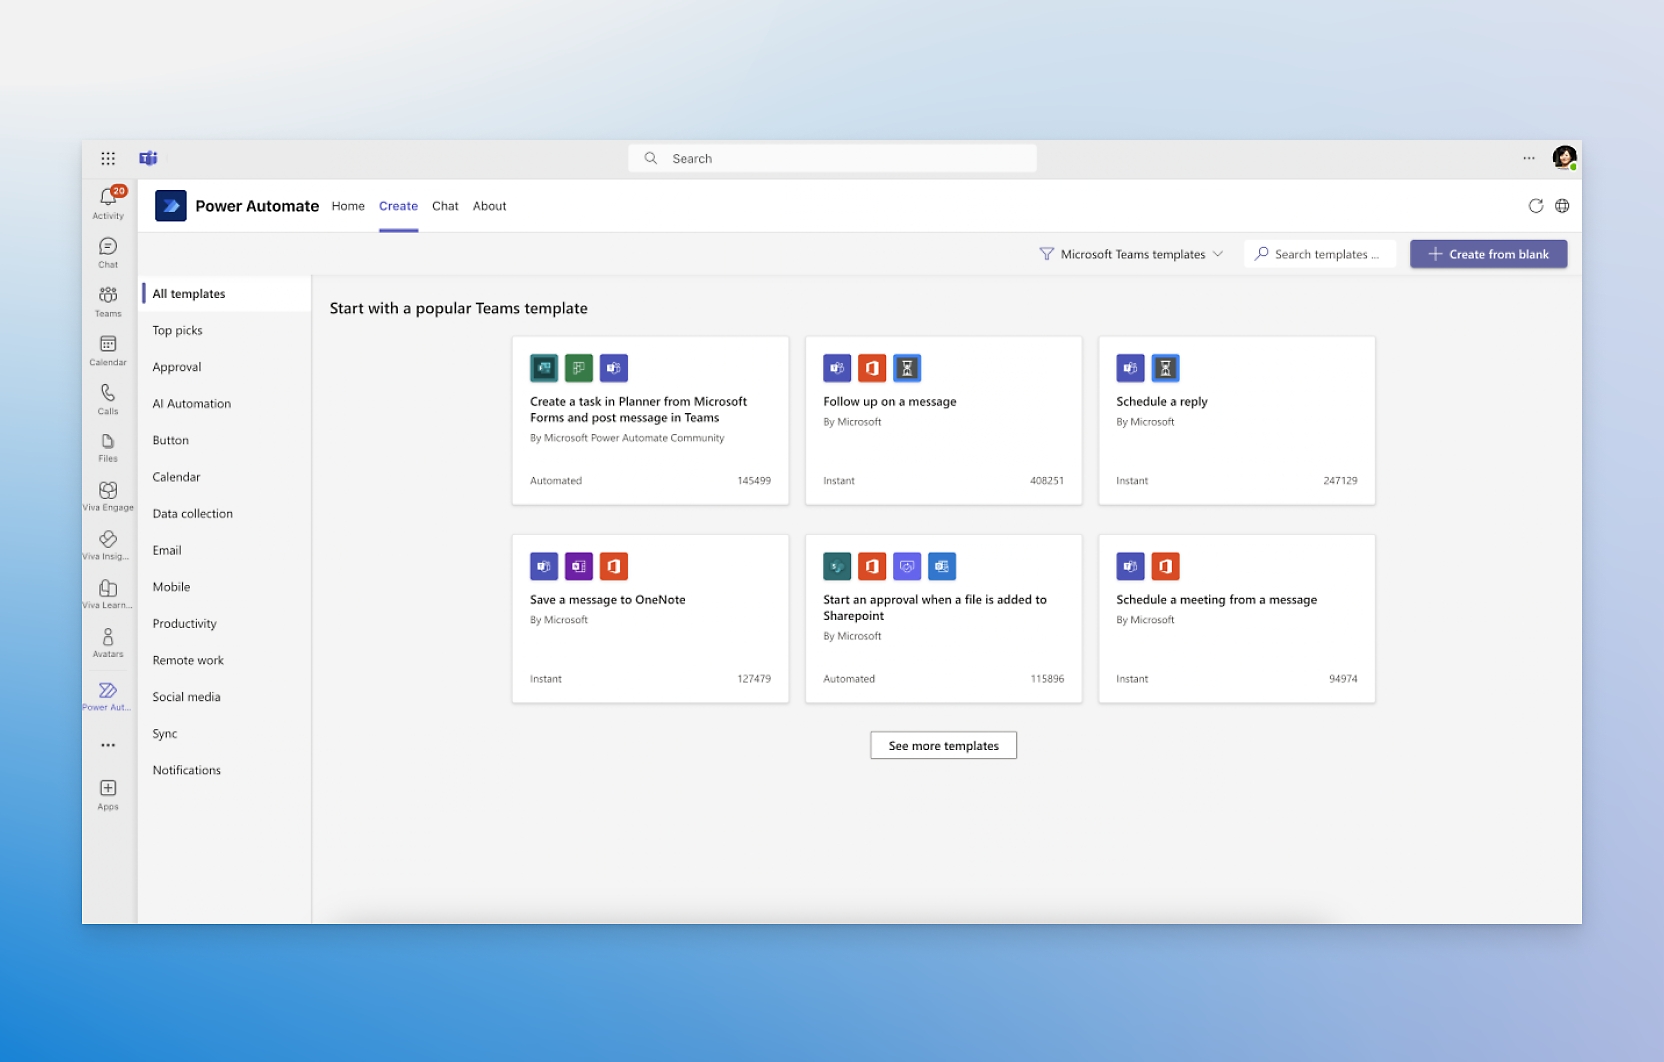
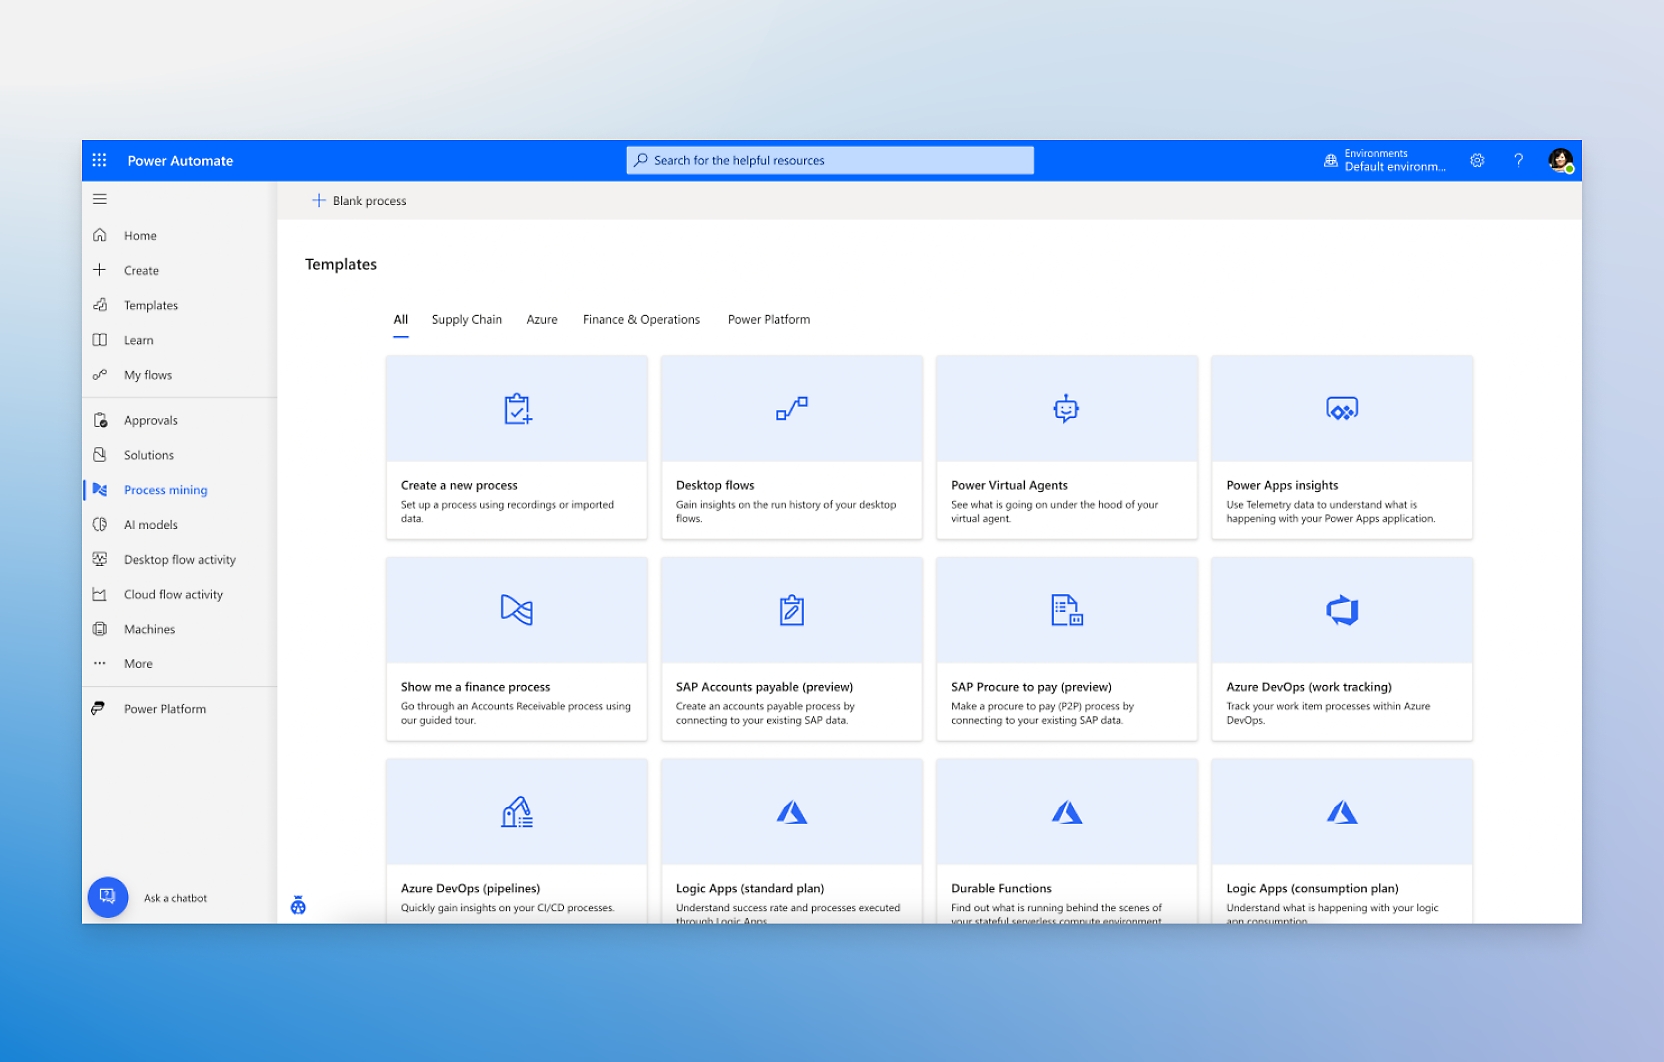
- Use digital process automation (DPA) to automate apps, data, and services running in the cloud or on premises.Start from scratch, use a prebuilt template, or engage the copilot to automate tasks and processes.Choose from more than 1,000 API connectors or create your own custom API connector.Native experiences in Microsoft 365, such as Microsoft Teams, Excel, and SharePoint, help you do more in your favorite apps.
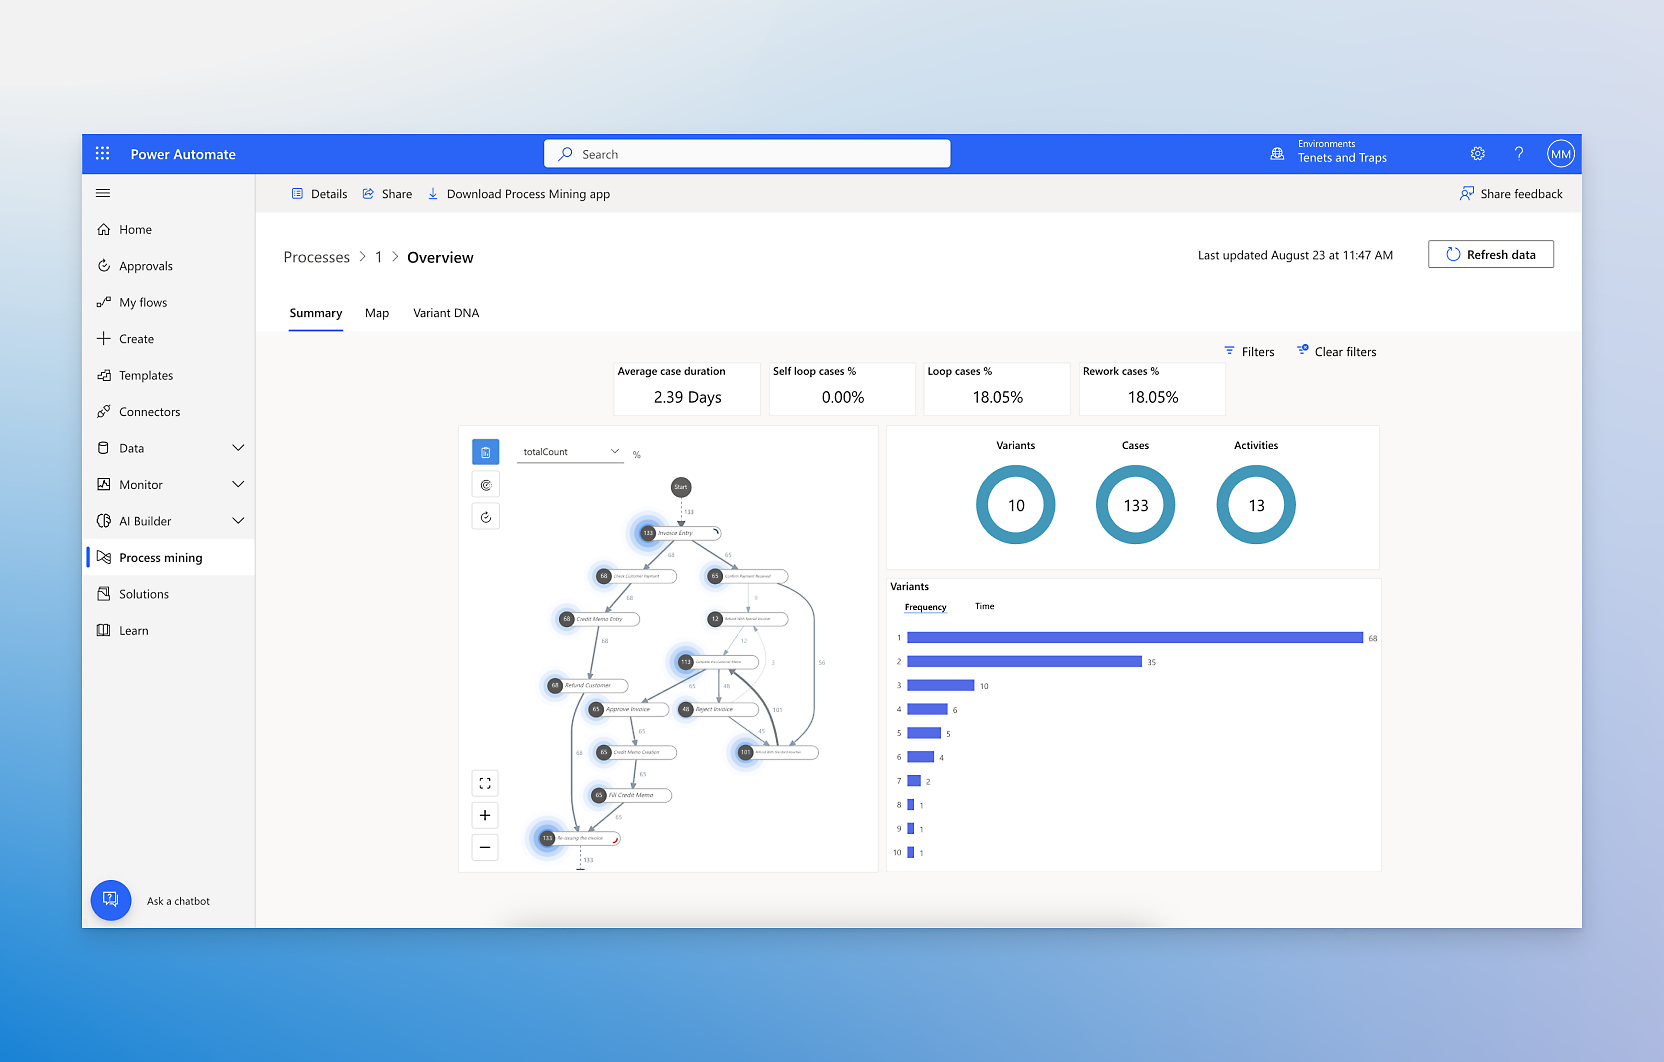
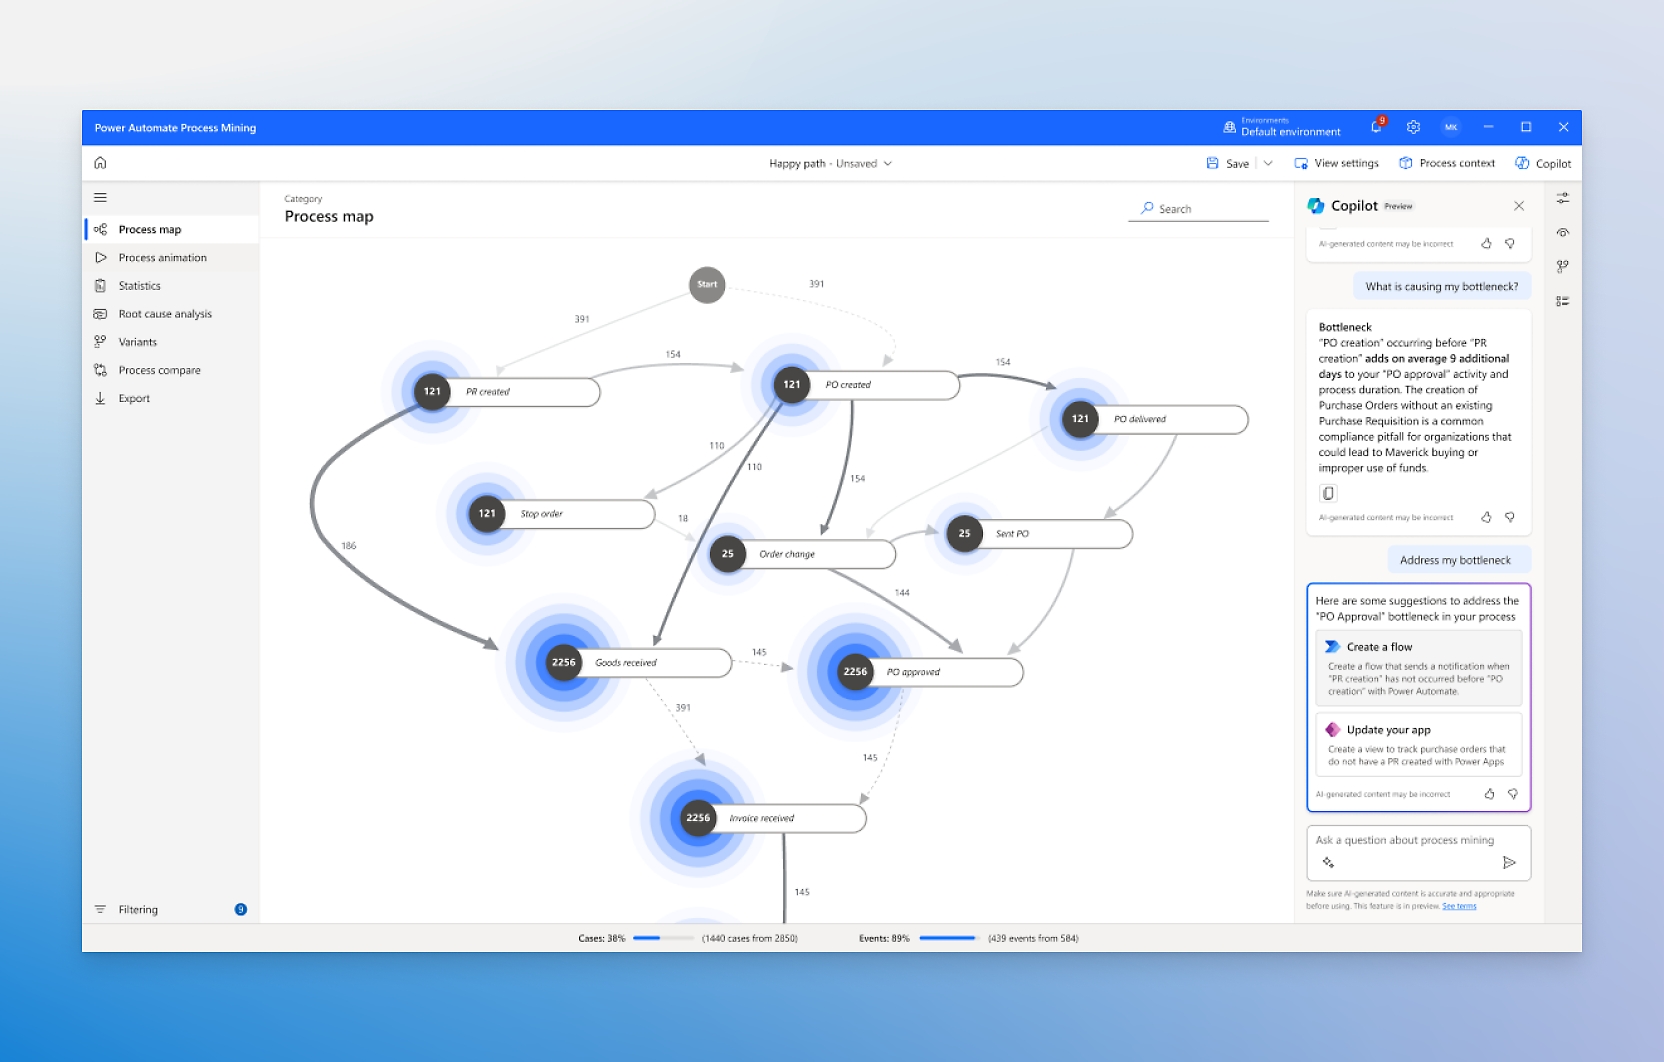
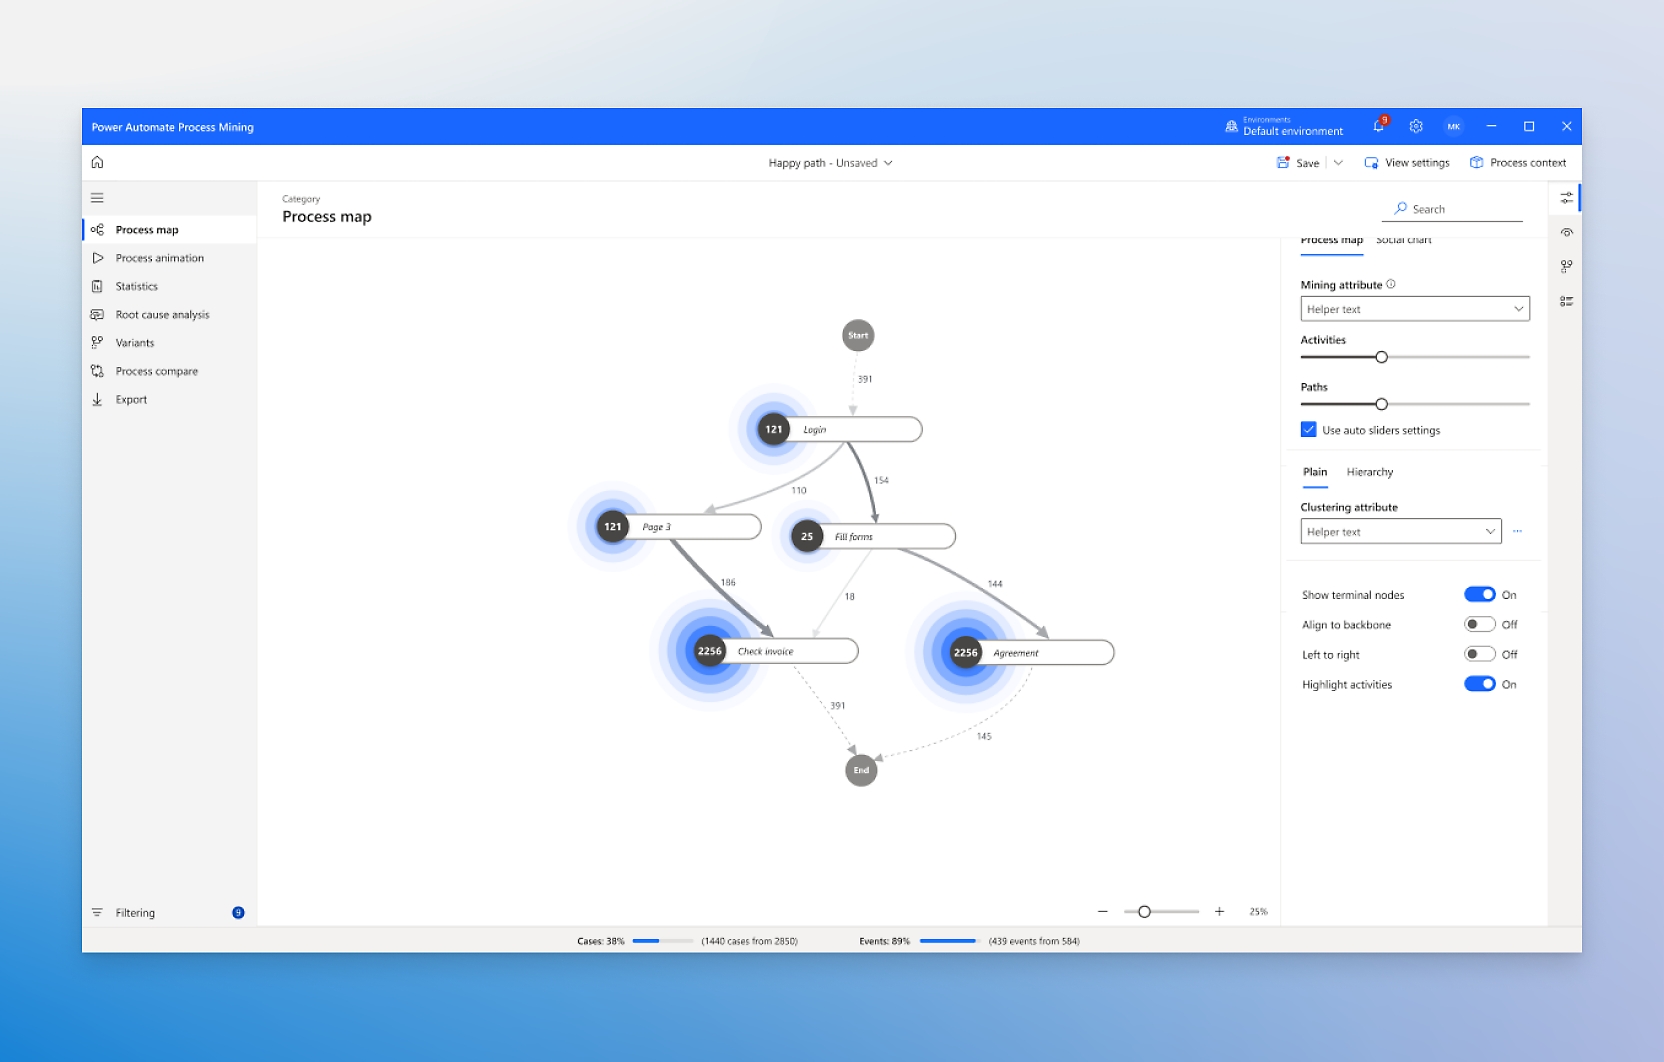
- Define and measure the business challenges of the process you want to analyze or improve.Choose from several built-in templates for rapid deployment, from data ingestion to predefined custom reports.Uncover ways to optimize business processes and automation with data-driven prioritization and AI guidance.Deliver return on investment (ROI) by acting on insights and establish continuous process monitoring and improvement.

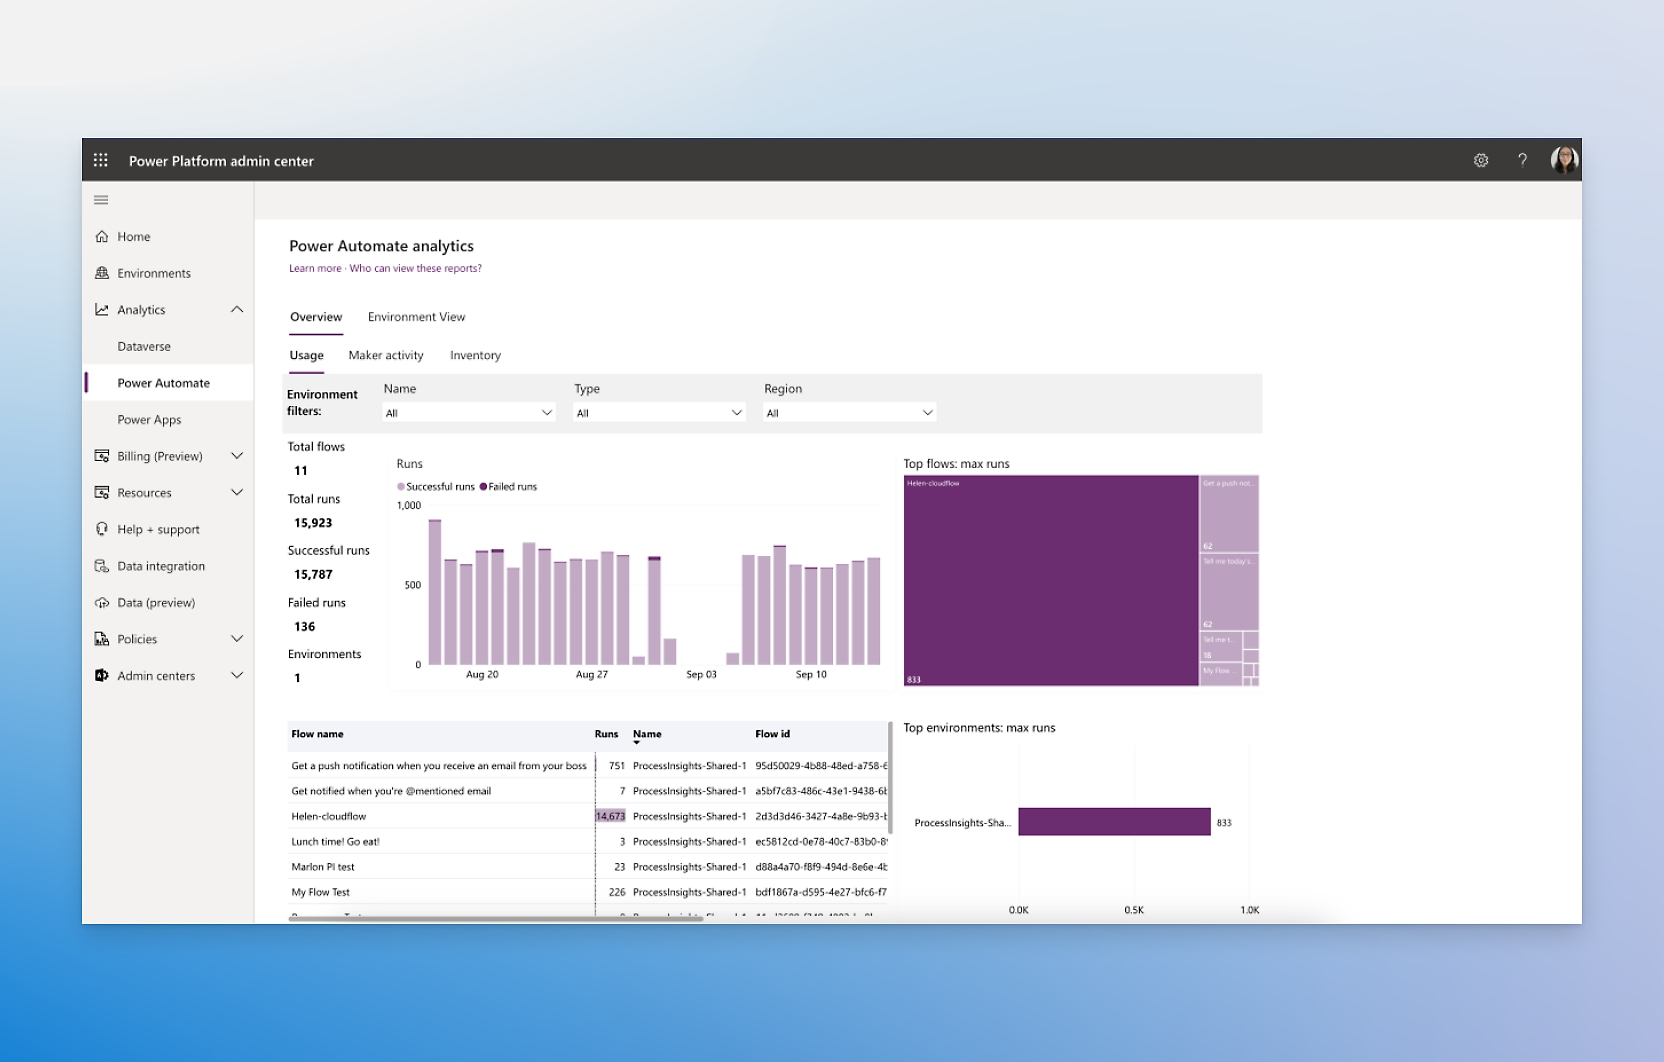
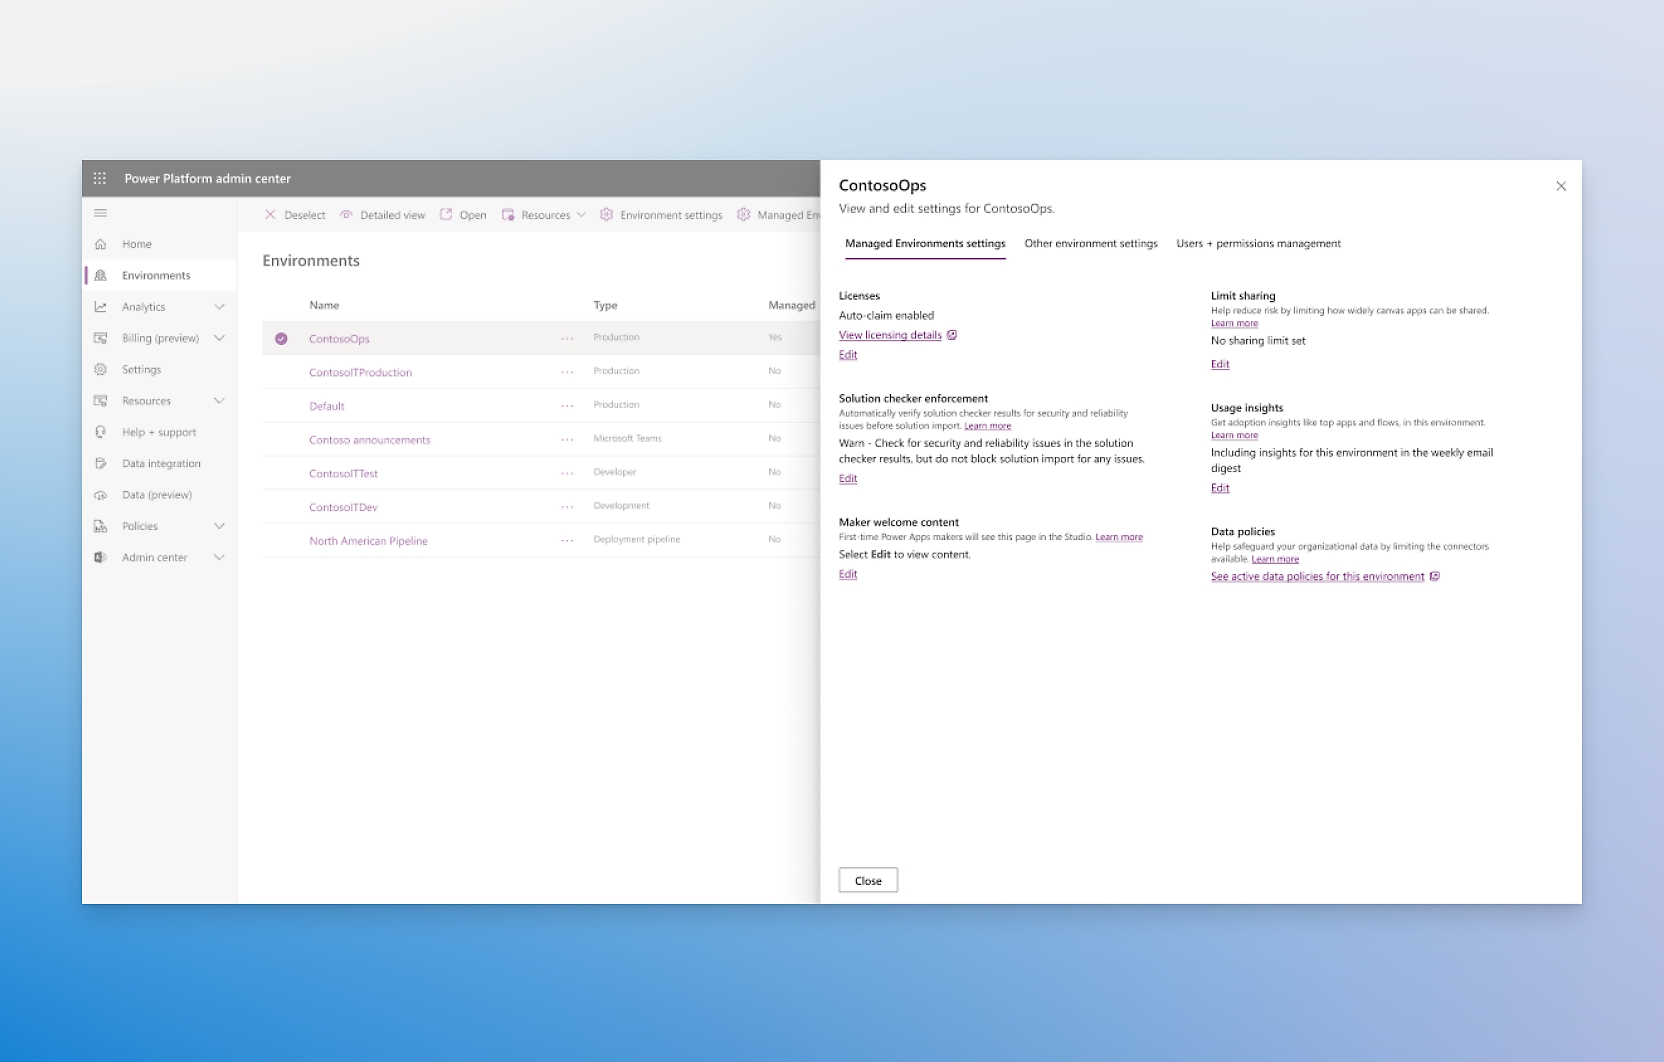
- Stay in control with 360-degree live monitoring, centralized governance, elastic scaling, and more.Take advantage of superior exception handling, work queues, and the Center of Excellence copilot experience.Use Managed Environments, data loss prevention, and more to help keep your data secure.Incorporate Power Automate with your existing solutions using standards-based programmatic access.


Systems of record, work, and collaboration
Powerful governance made easier
SAP procurement solution template
Streamlined approval processes
Interoperation with Microsoft 365
Innovative document automation
Data-driven business automation
Achieve high ROI with low code and AI
Recognized by top industry analysts


Power Automate pricing
Free trial
Power Automate Premium
Power Automate Process

Get expert help from Power Automate partners
Real stories, real impact


Explore news, training, and support


-
To use Power Automate, all you need is a web browser and an email address.
-
Power Automate can be used on a large variety of devices and browsers. For the best results on a mobile device, use the Power Automate mobile app for iOS, Android, and Windows. For browsers, use the most up-to-date version compatible with your operating system: Microsoft Edge, Safari, Chrome, or Firefox. The Power Automate for desktop app is also available for the Windows 10 and 11 operating systems.
-
No, Power Automate is a cloud service. However, you can securely connect to your own on-premises services through its on-premises data gateway.
-
More than 1,000 prebuilt, certified connectors are available for Power Automate, including popular services like Dynamics 365, SAP, and Salesforce. You can also build a custom connector to any cloud application and have it certified for sharing broadly with the Power Automate community. To extend to a non-API service, use RPA to connect to systems.
-
Templates are prebuilt flows for popular and common scenarios. To use one, you just need to have access to the services in the template and to input any required settings.
-
Yes. You can add co-workers or groups in your organization as owners so they can edit and manage the flows. Or, for flows that can be run manually, you can grant other people or groups in your organization permission to run them.
-
The number depends on the type of license you hold. Power Automate offers a great deal of flexibility in licensing and pricing to cover a broad range of use cases. Contact your administrator for details regarding your current license, or see pricing details.

Take the next step
Start using Power Automate for free
Contact Sales
Request we contact you
[1] Microsoft research, September 2023.
[2] The Total Economic Impact™ of Microsoft Power Platform Premium Capabilities, a commissioned study conducted by Forrester Consulting on behalf of Microsoft, August 2022. Data reflects the three-year ROI and net present value (NPV) of adopting Power Platform premium capabilities for a composite organization.
[3] Gartner, Magic Quadrant for Enterprise Low-Code Application Platforms, Oleksandr Matvitskyy, Kimihiko Iijima, Mike West, Kyle Davis, Akash Jain, Paul Vincent, 17 October 2023. Gartner is a registered trademark and service mark and Magic Quadrant is a registered trademark of Gartner, Inc. and/or its affiliates in the U.S. and internationally and are used herein with permission. All rights reserved.
Gartner does not endorse any vendor, product or service depicted in its research publications, and does not advise technology users to select only those vendors with the highest ratings or other designation. Gartner research publications consist of the opinions of Gartner's research organization and should not be construed as statements of fact. Gartner disclaims all warranties, expressed or implied, with respect to this research, including any warranties of merchantability or fitness for a particular purpose.
[4] Gartner, Magic Quadrant for Robotic Process Automation, Saikat Ray, Arthur Villa, Melanie Alexander, Andy Wang, Mukul Saha, Sachin Joshi, 2 August 2023. Gartner is a registered trademark and service mark and Magic Quadrant is a registered trademark of Gartner, Inc. and/or its affiliates in the U.S. and internationally and are used herein with permission. All rights reserved.
Gartner does not endorse any vendor, product or service depicted in its research publications, and does not advise technology users to select only those vendors with the highest ratings or other designation. Gartner research publications consist of the opinions of Gartner's research organization and should not be construed as statements of fact. Gartner disclaims all warranties, expressed or implied, with respect to this research, including any warranties of merchantability or fitness for a particular purpose.
[5] Requires access to the Microsoft 365 admin center with global administrator or billing administrator roles.
Follow Power Platform